


E Lesson Plan
Grade 4 Graphing & Probability Bundle!
EBOTM112101
$16.49 CAD
Additional information:
Graphing:
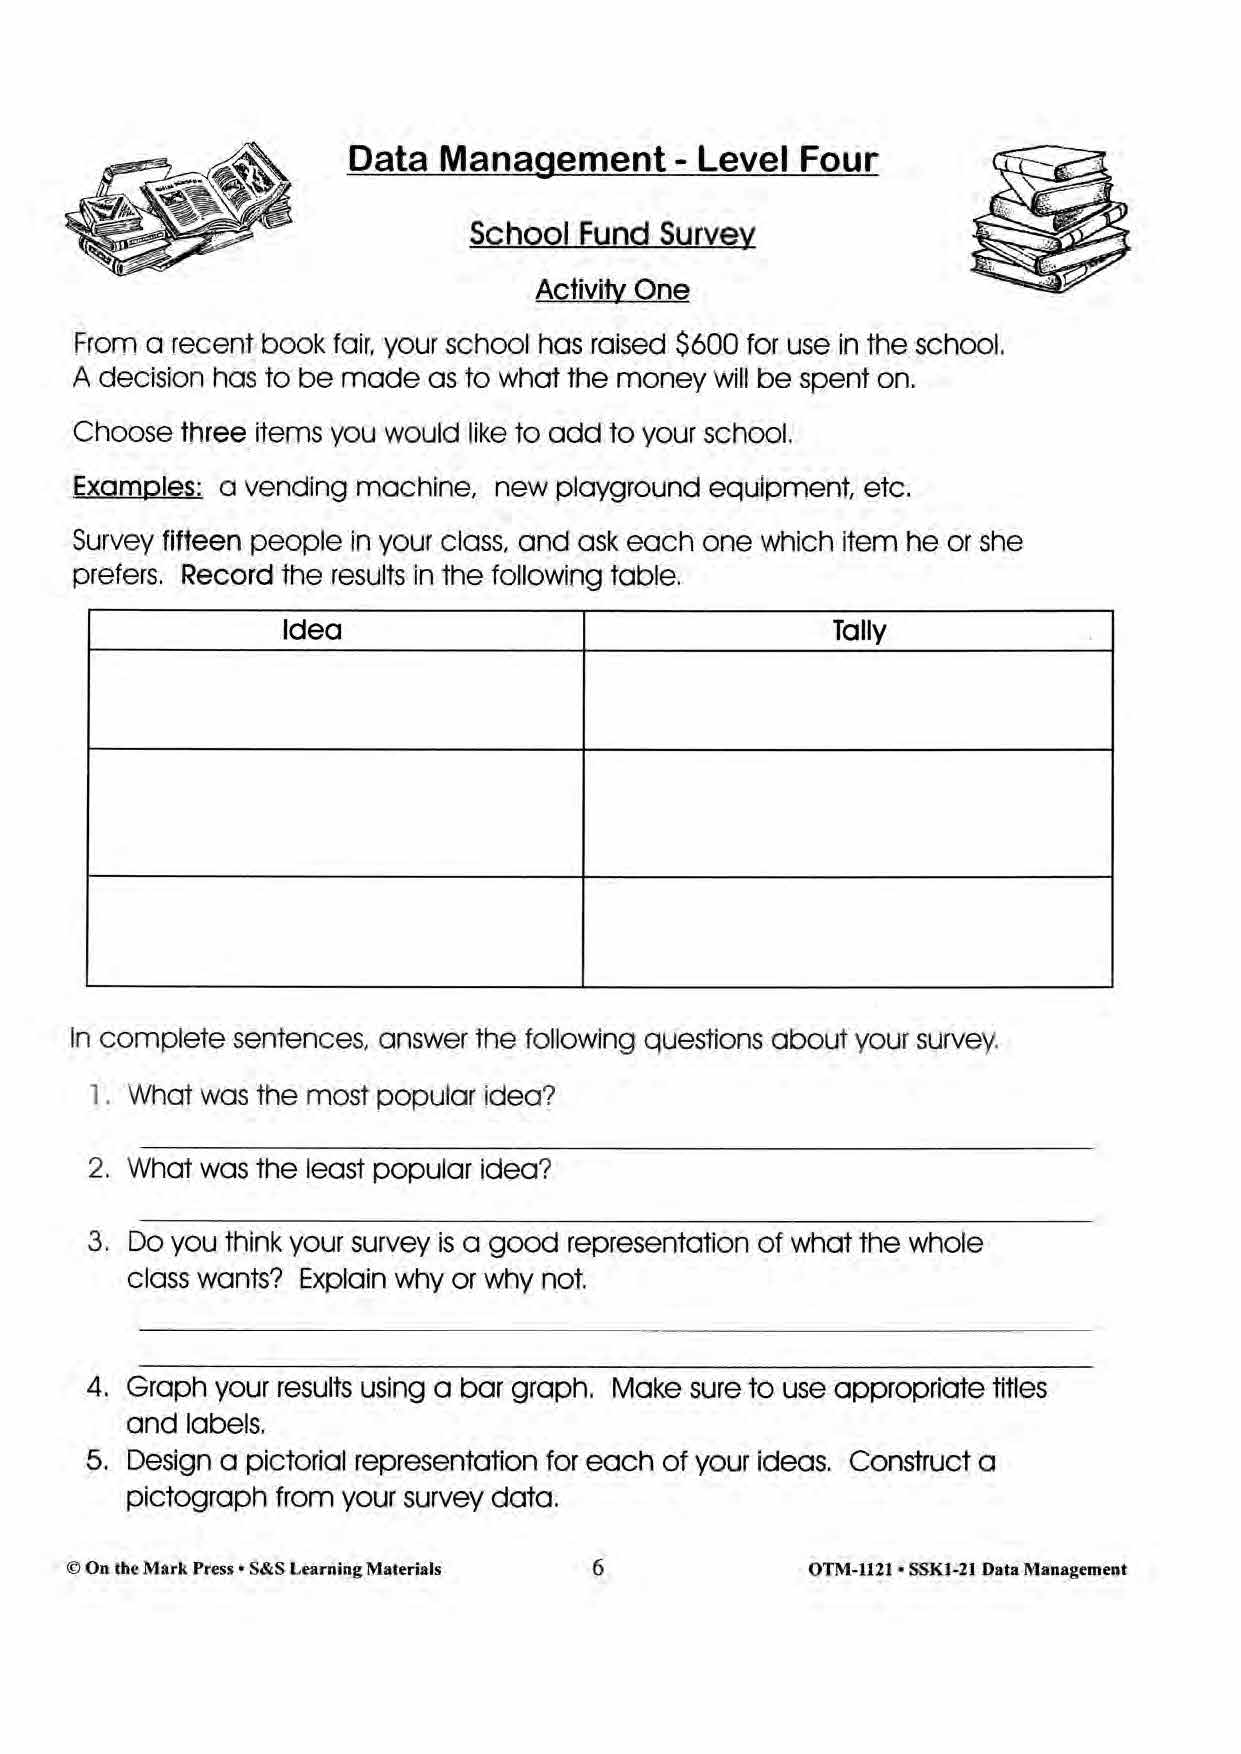
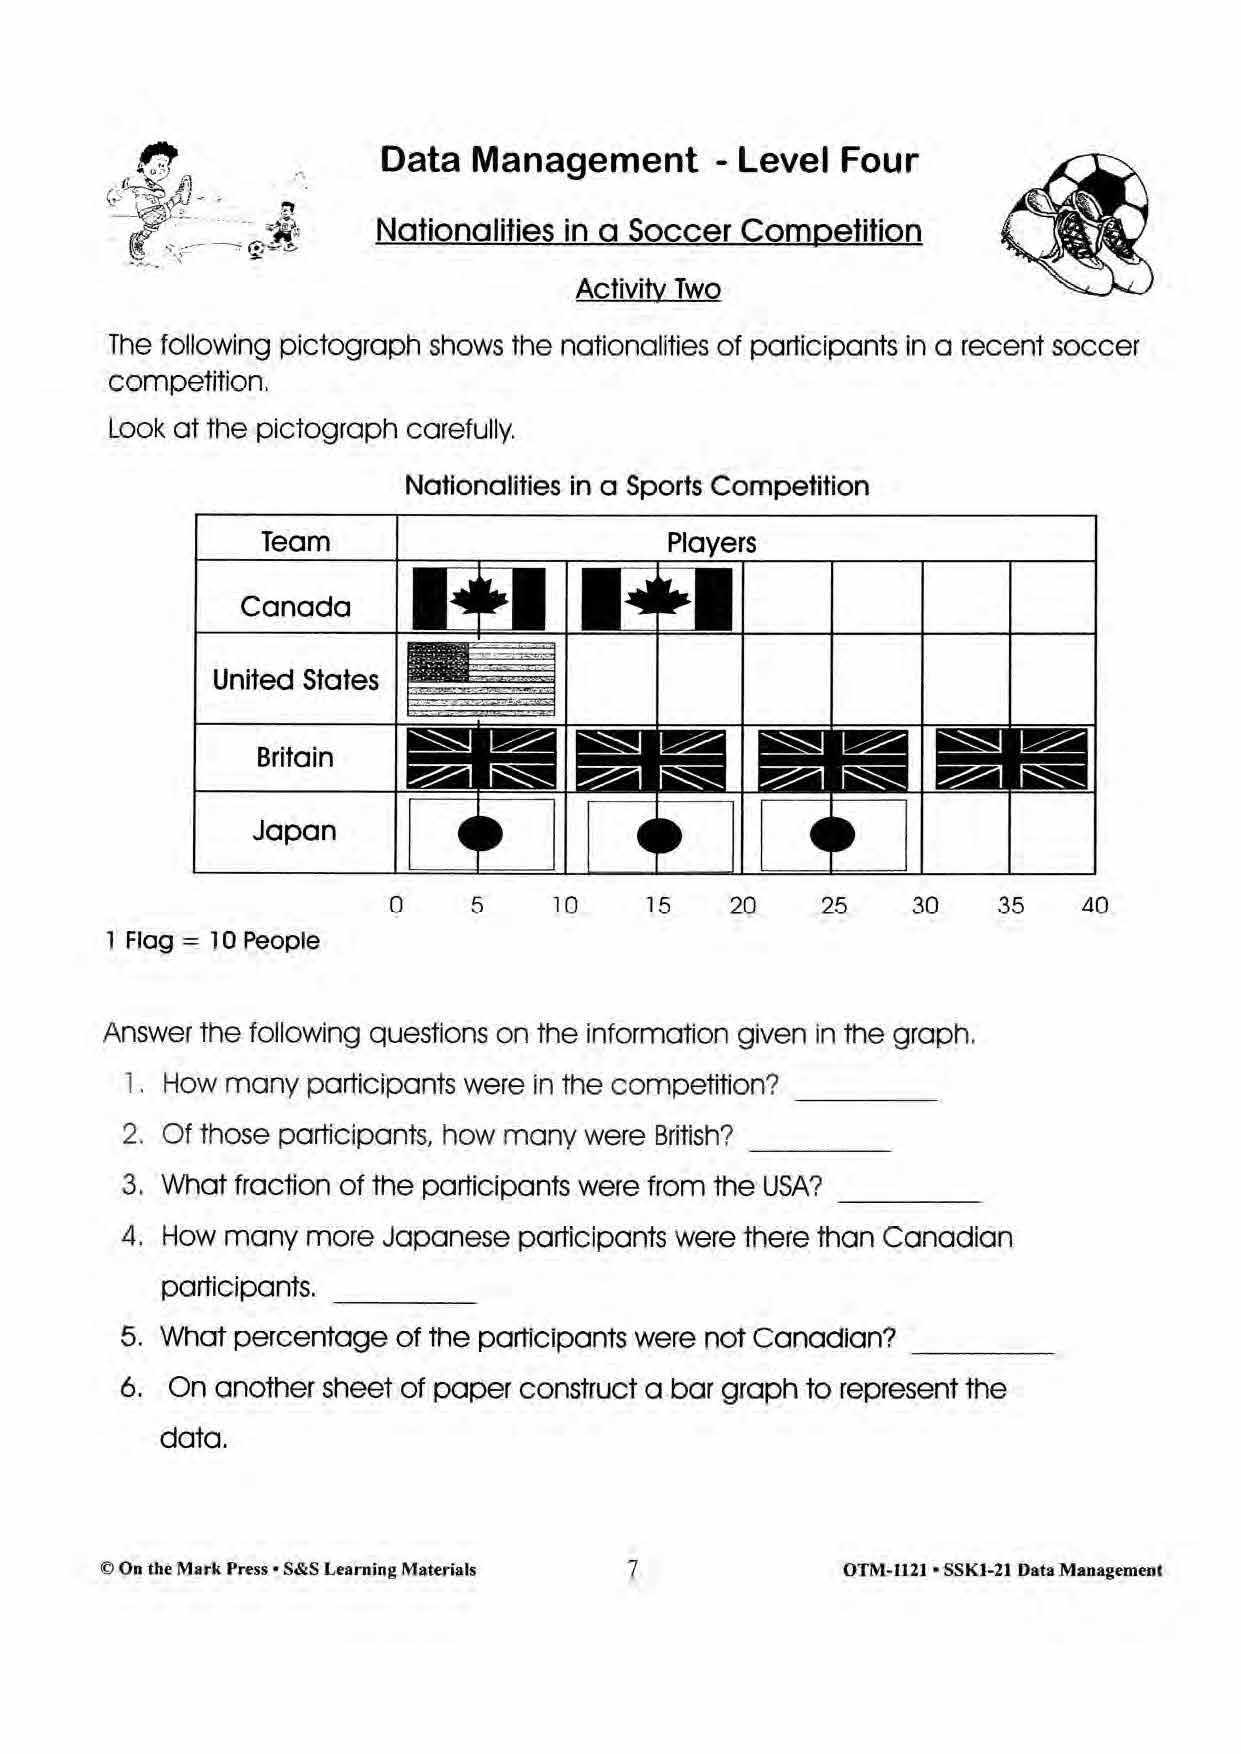
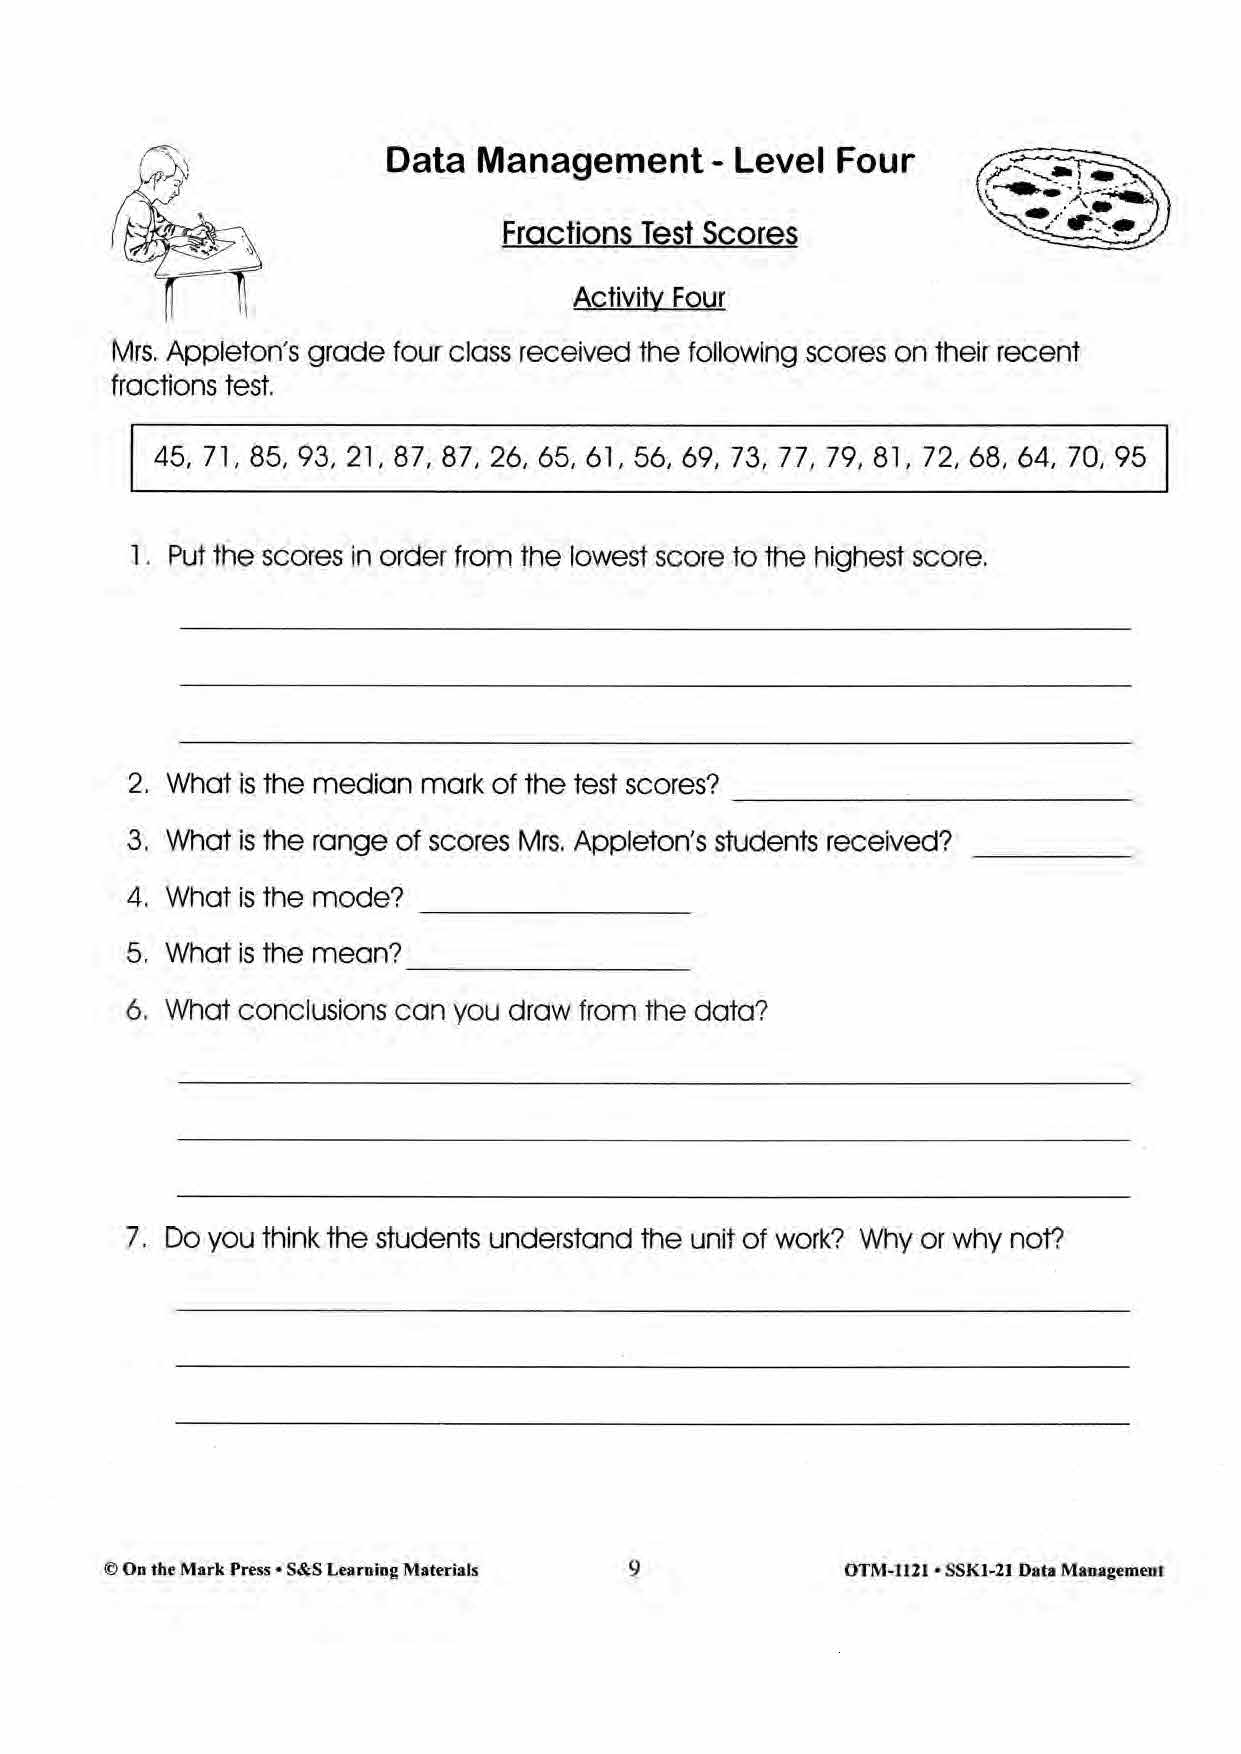
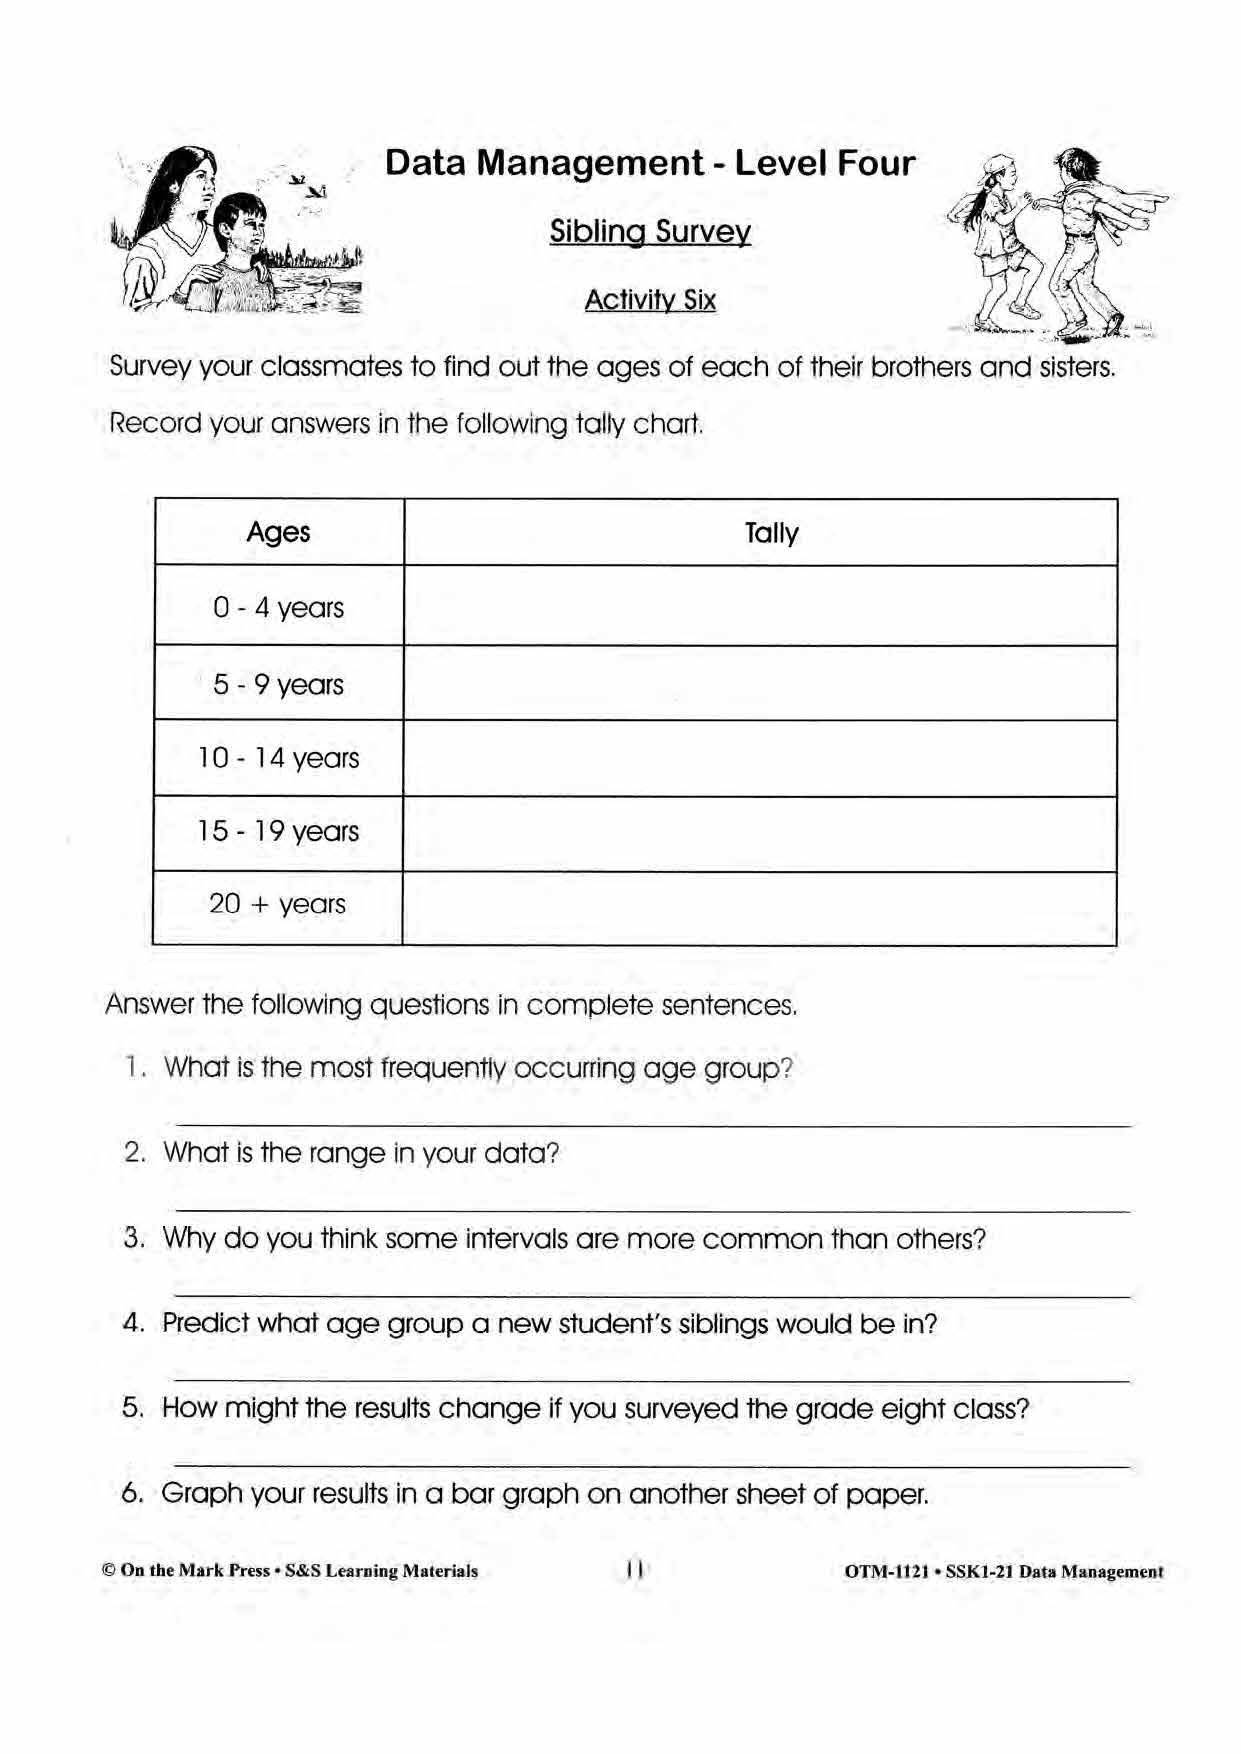
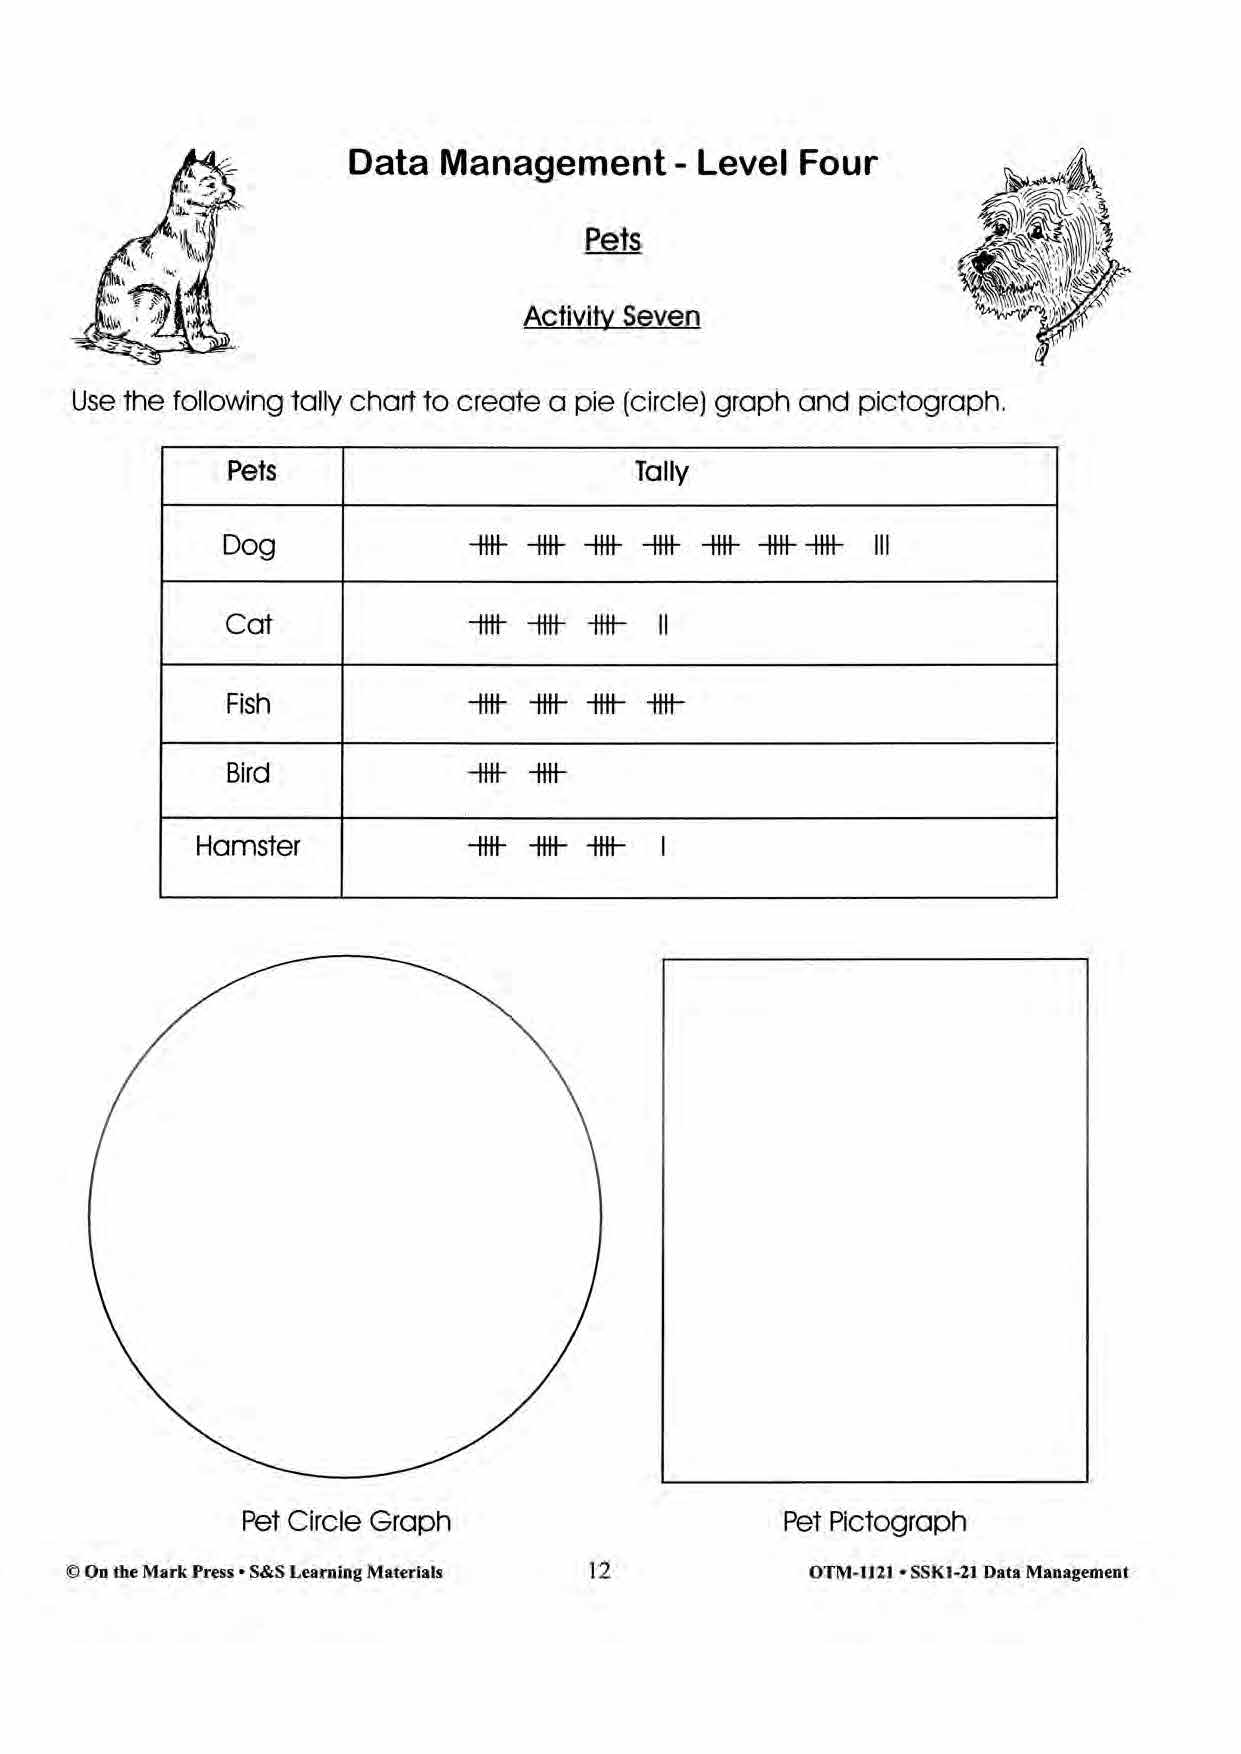
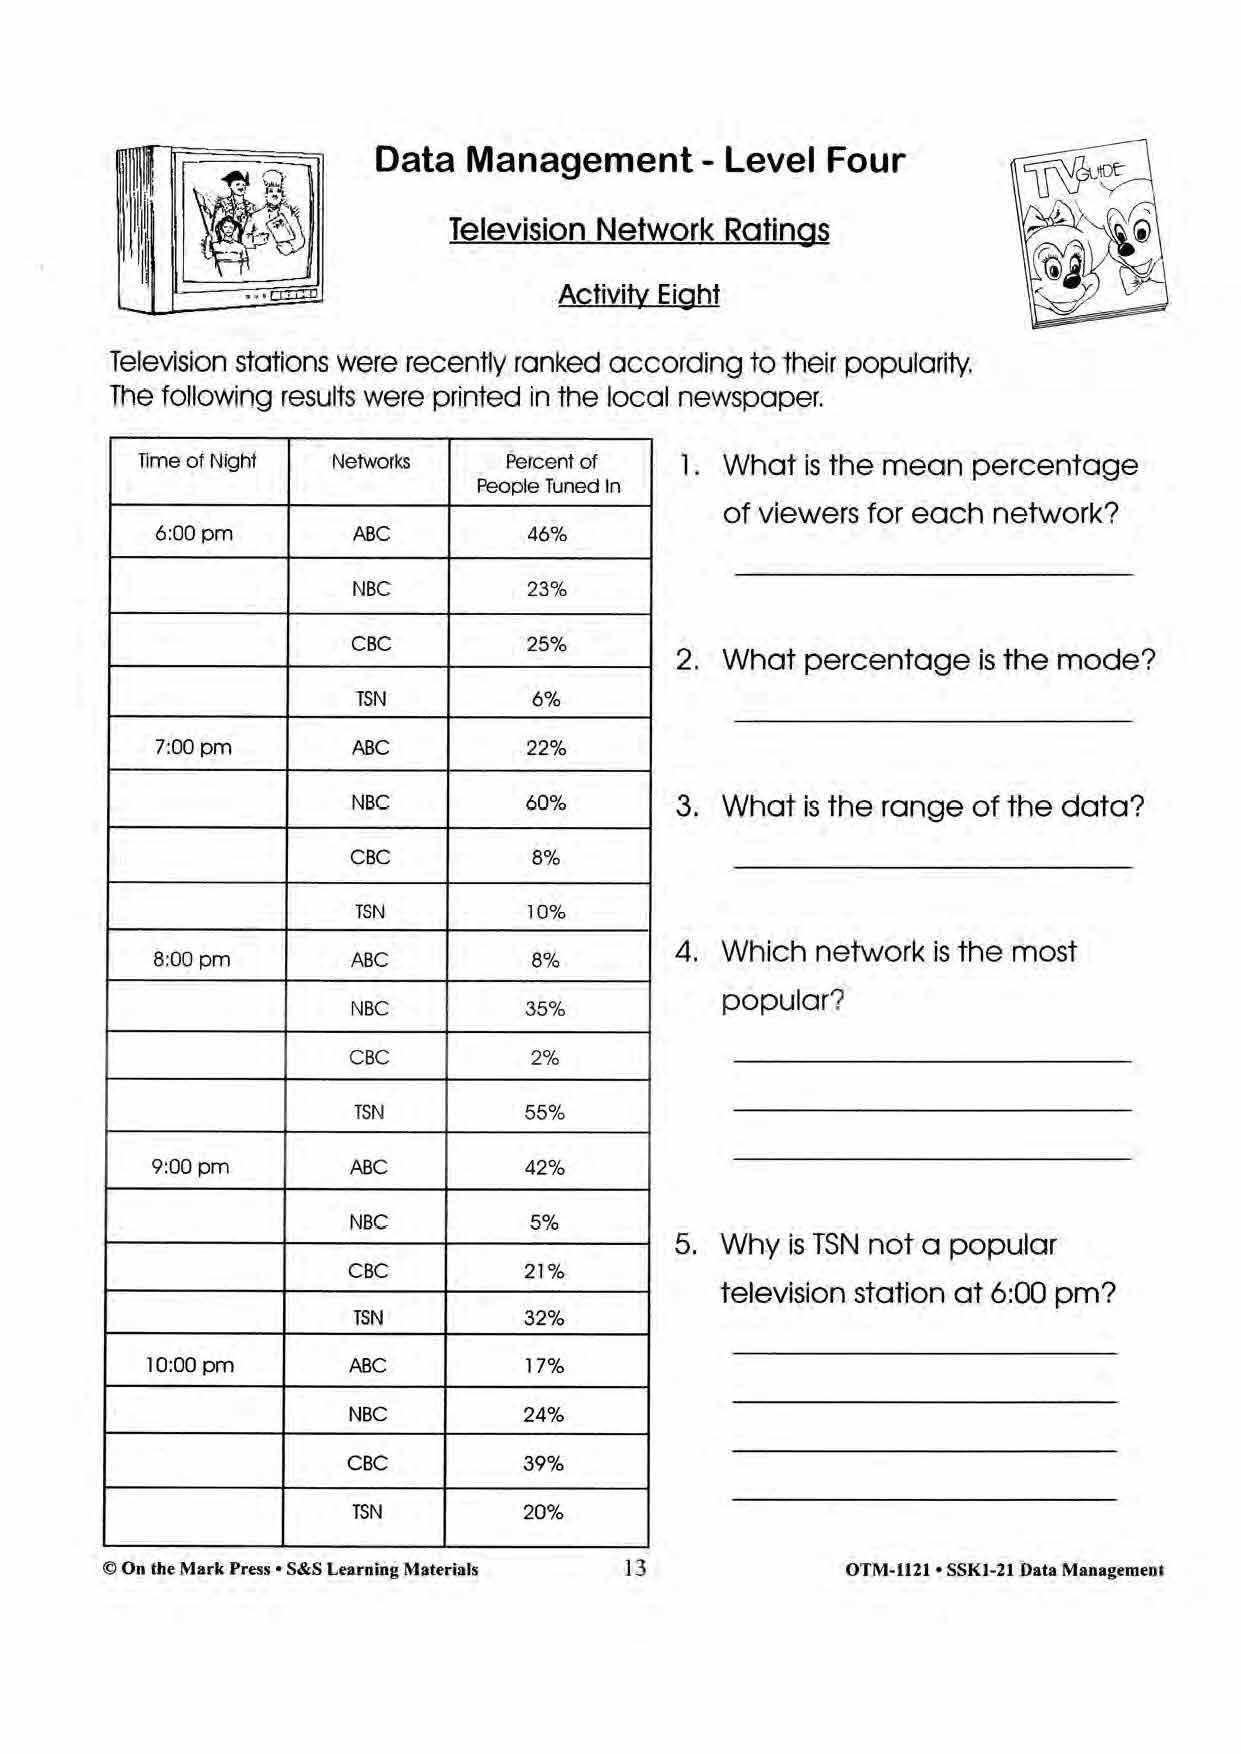
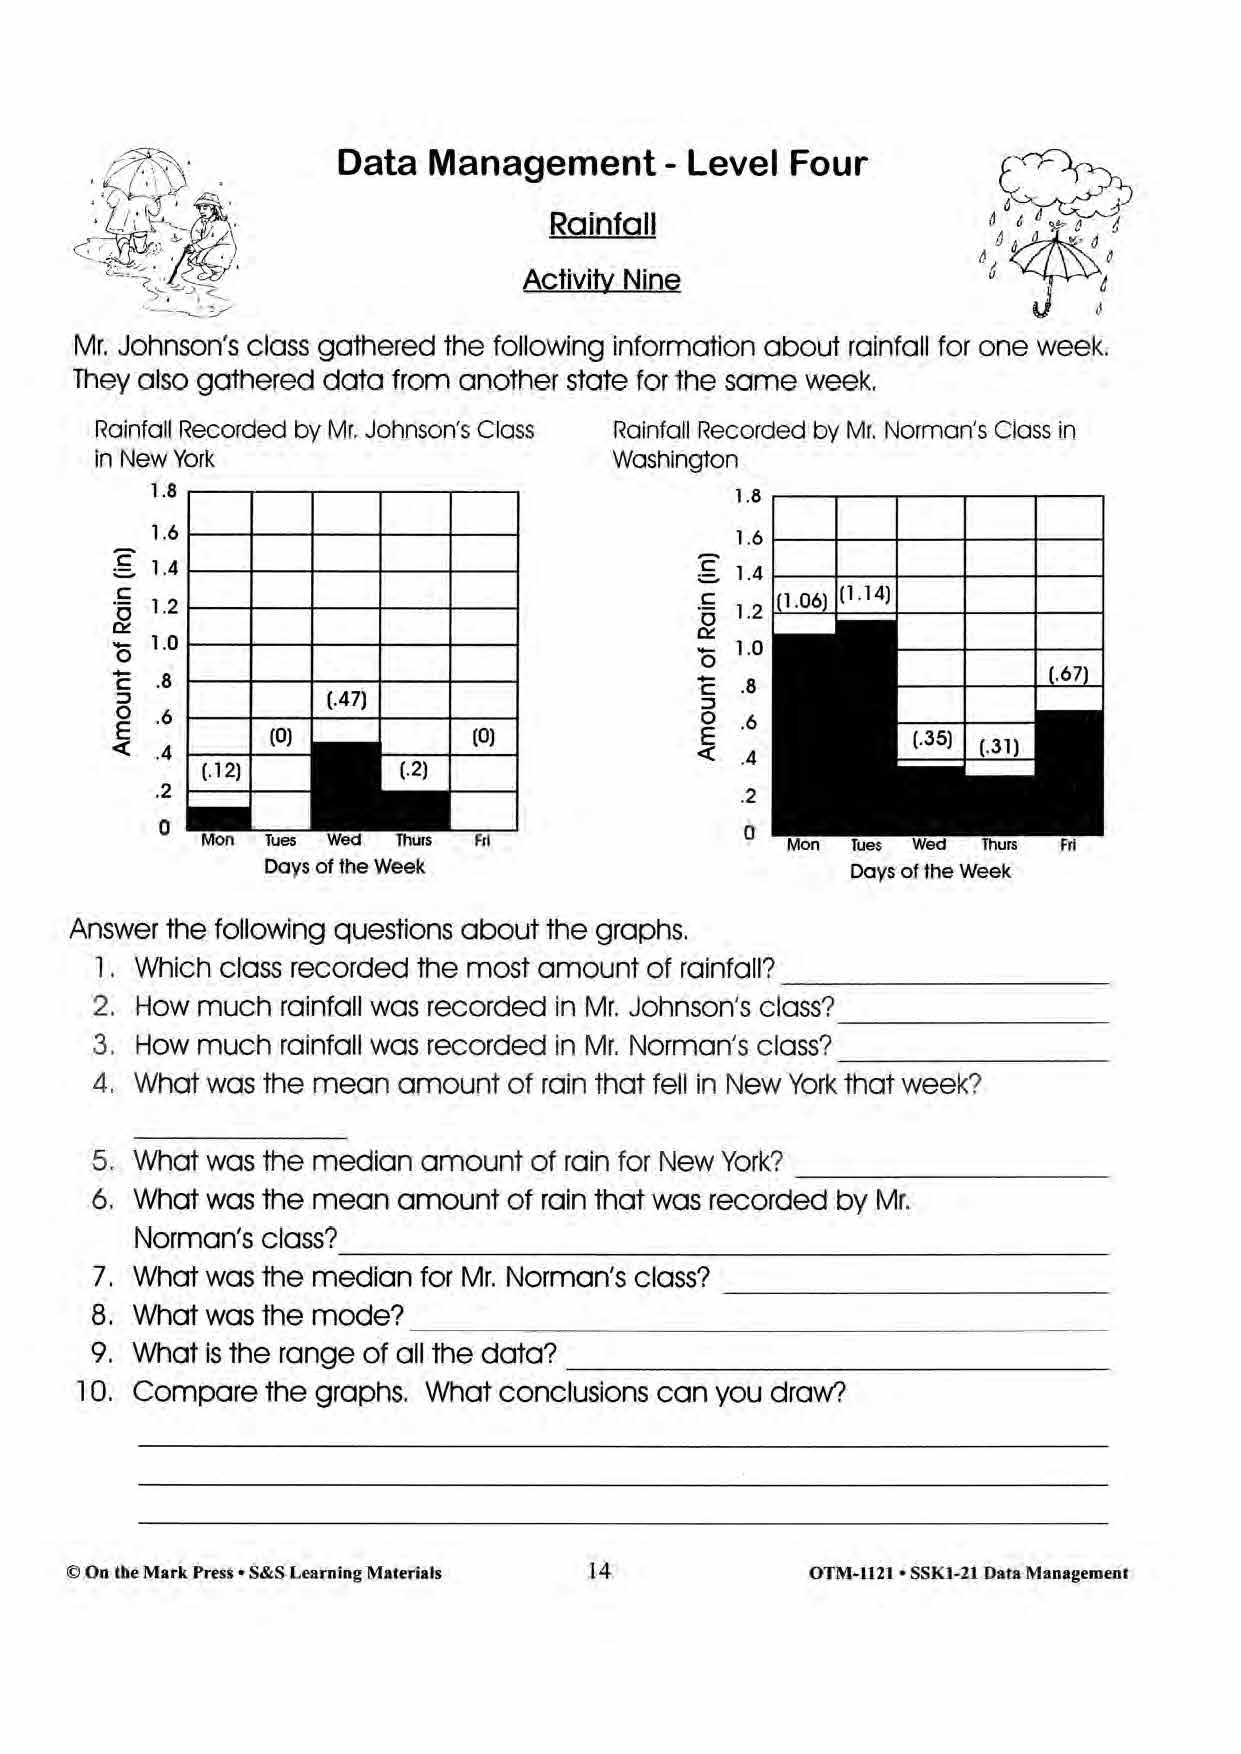
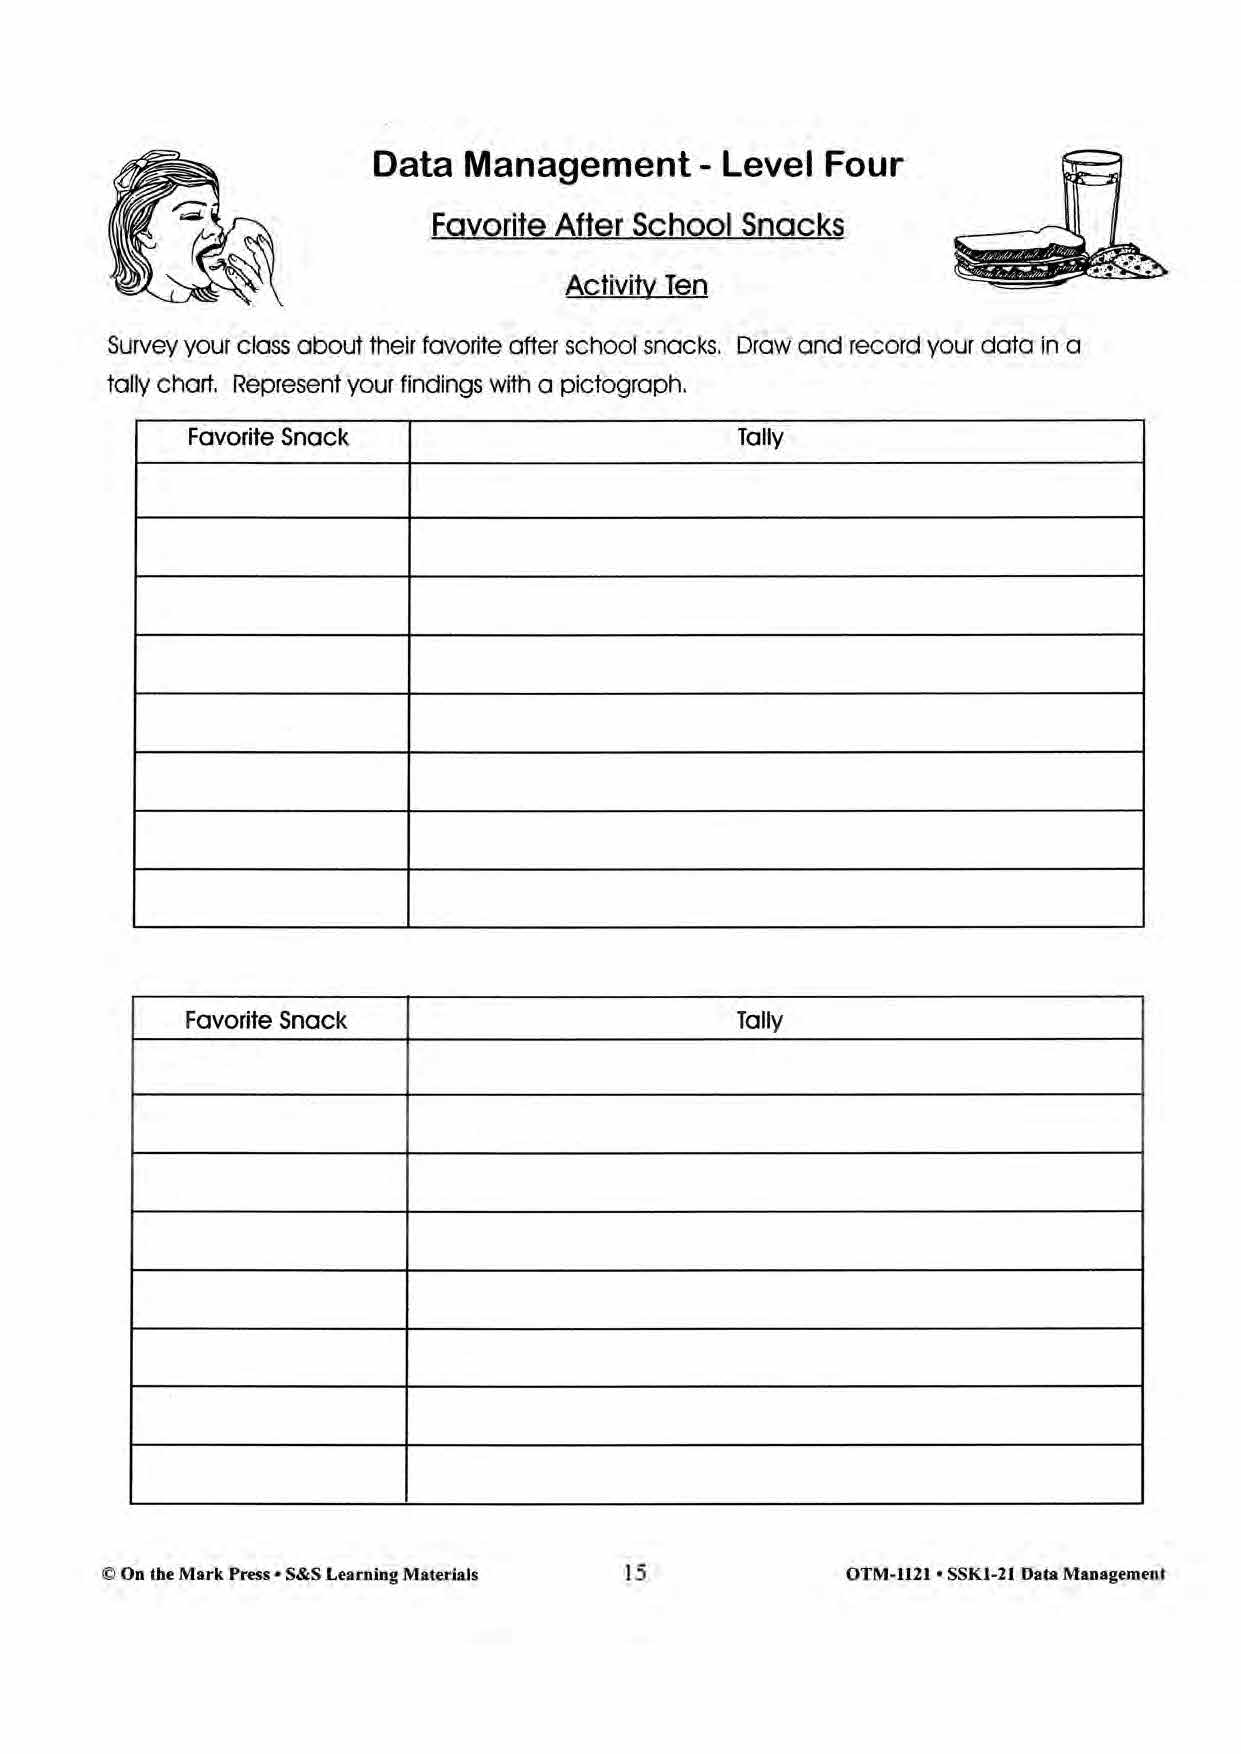
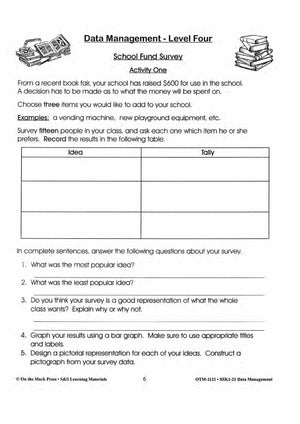
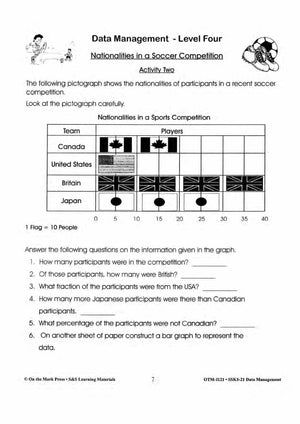
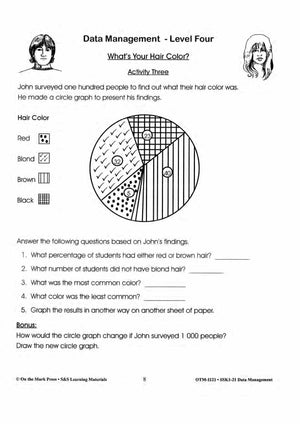
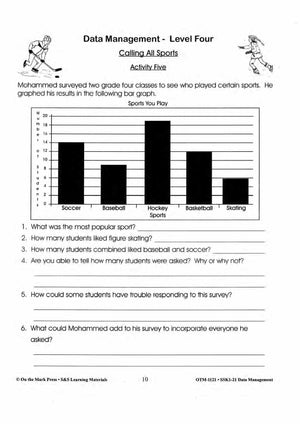
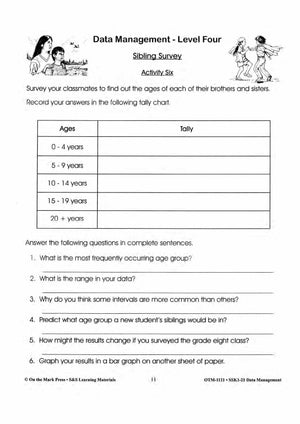
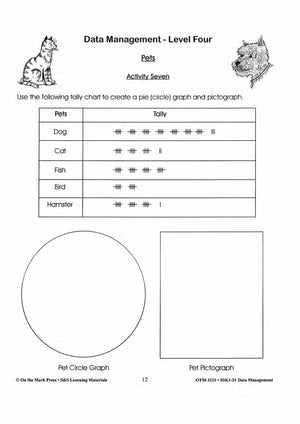
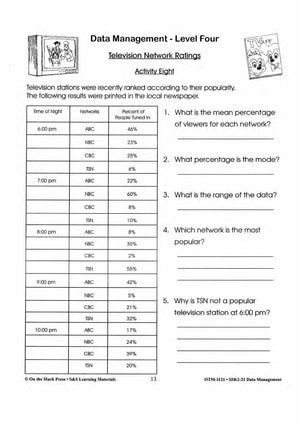
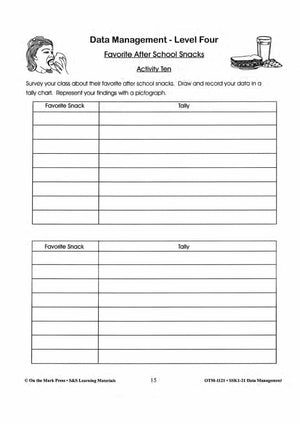
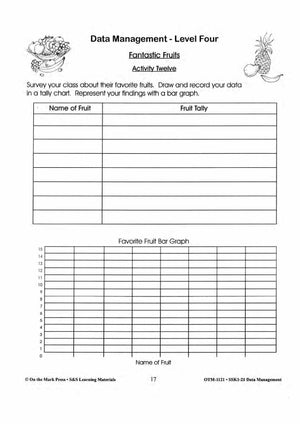
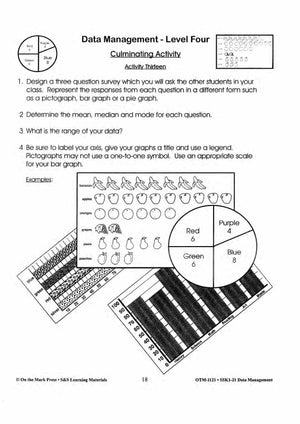
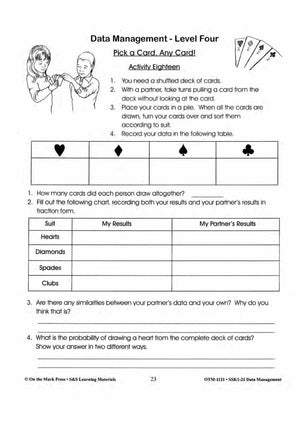
- Students are expected to understand and be able to draw tally charts, pictographs, circle graphs, and bar graphs. They are also expected to be able to calculate the mean, median, mode, and range of given sets of data. Basic skills in surveying are extended. It is advisable, to begin with, simple surveys and tally charts, proceeding to pictographs, bar graphs, and circle graphs in that order. A culminating activity has been included that can be used for evaluation of their knowledge and skills.
- When constructing pictographs and bar graphs, students should be able to use a one to one correspondence as well as a one to many correspondences; for example, one picture in the pictograph represents ten people. All graphs should be labeled appropriately on both the V axis and the X-axis. Each graph should have a title that pertains to the data and an appropriate scale.
Probability:
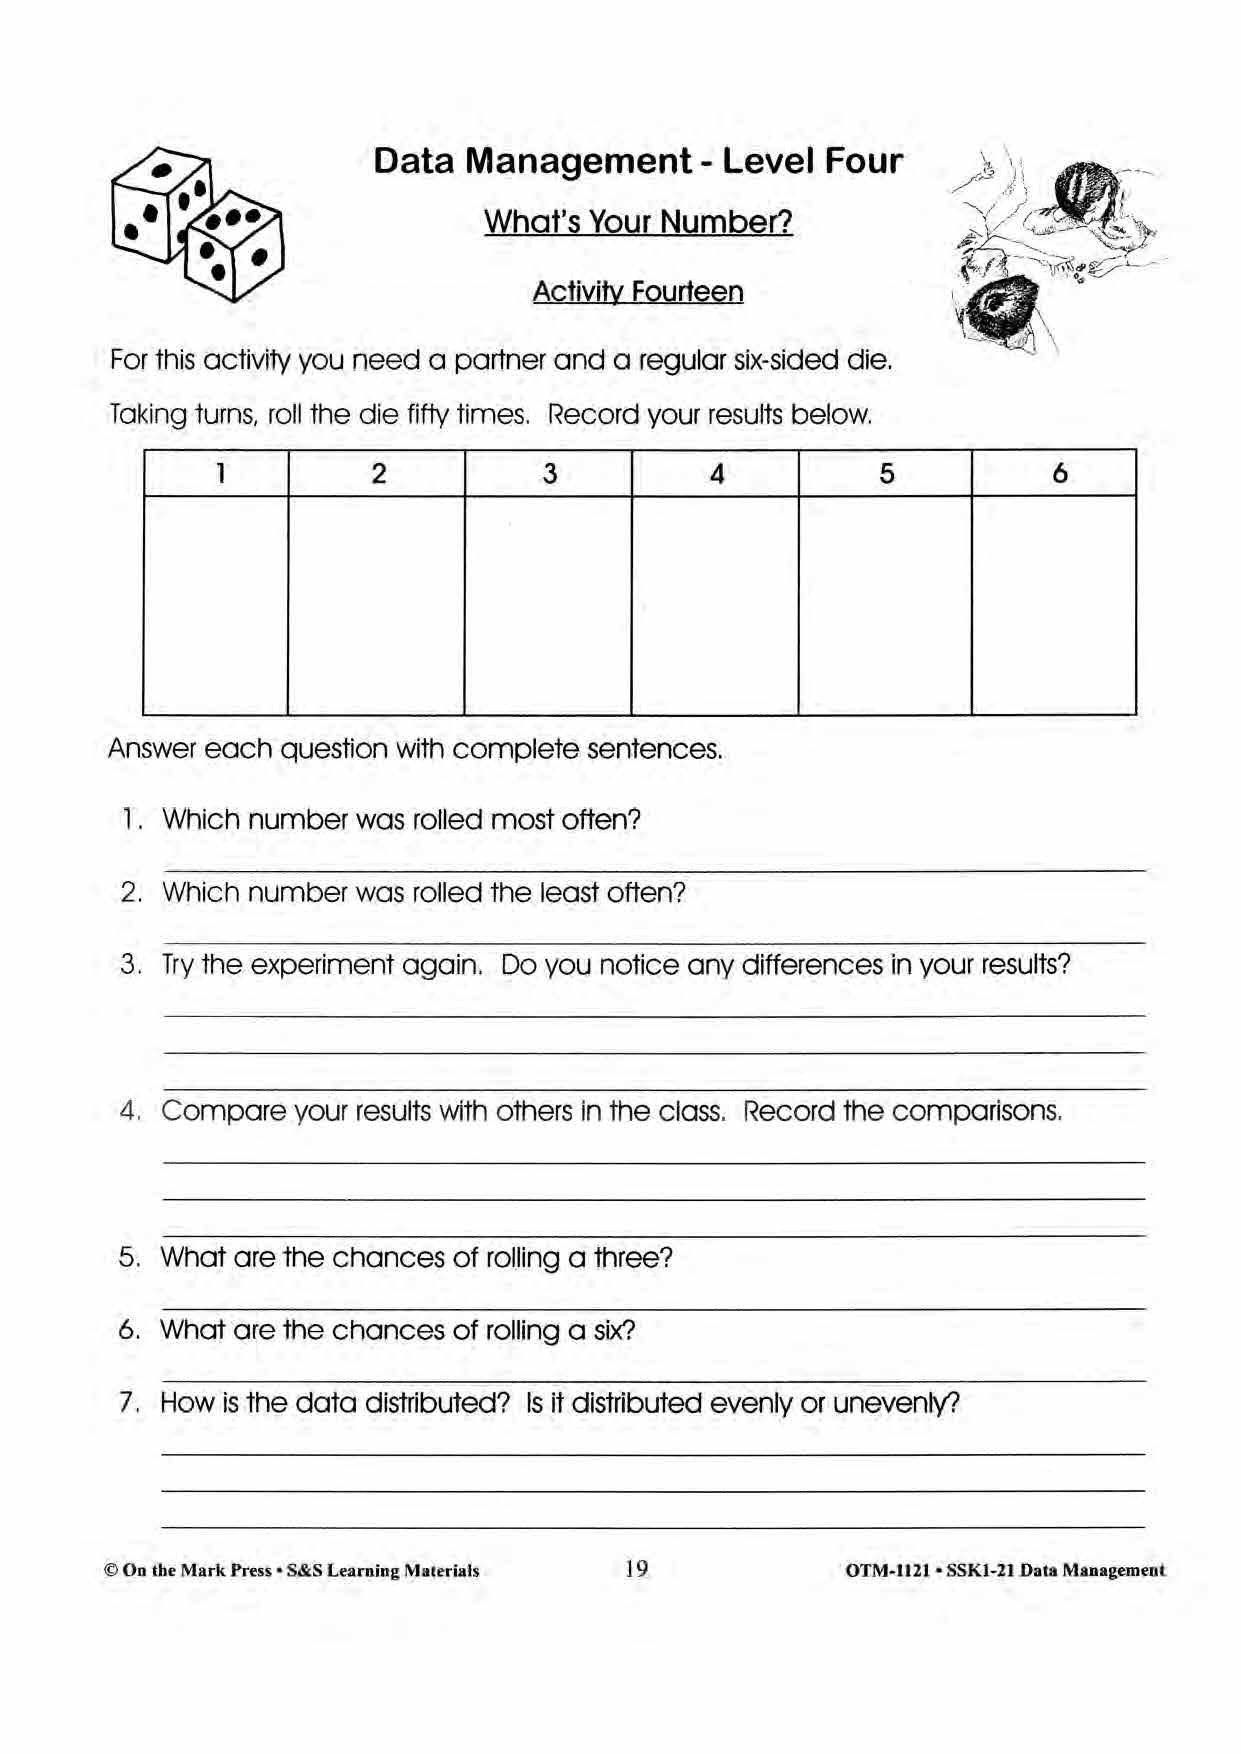
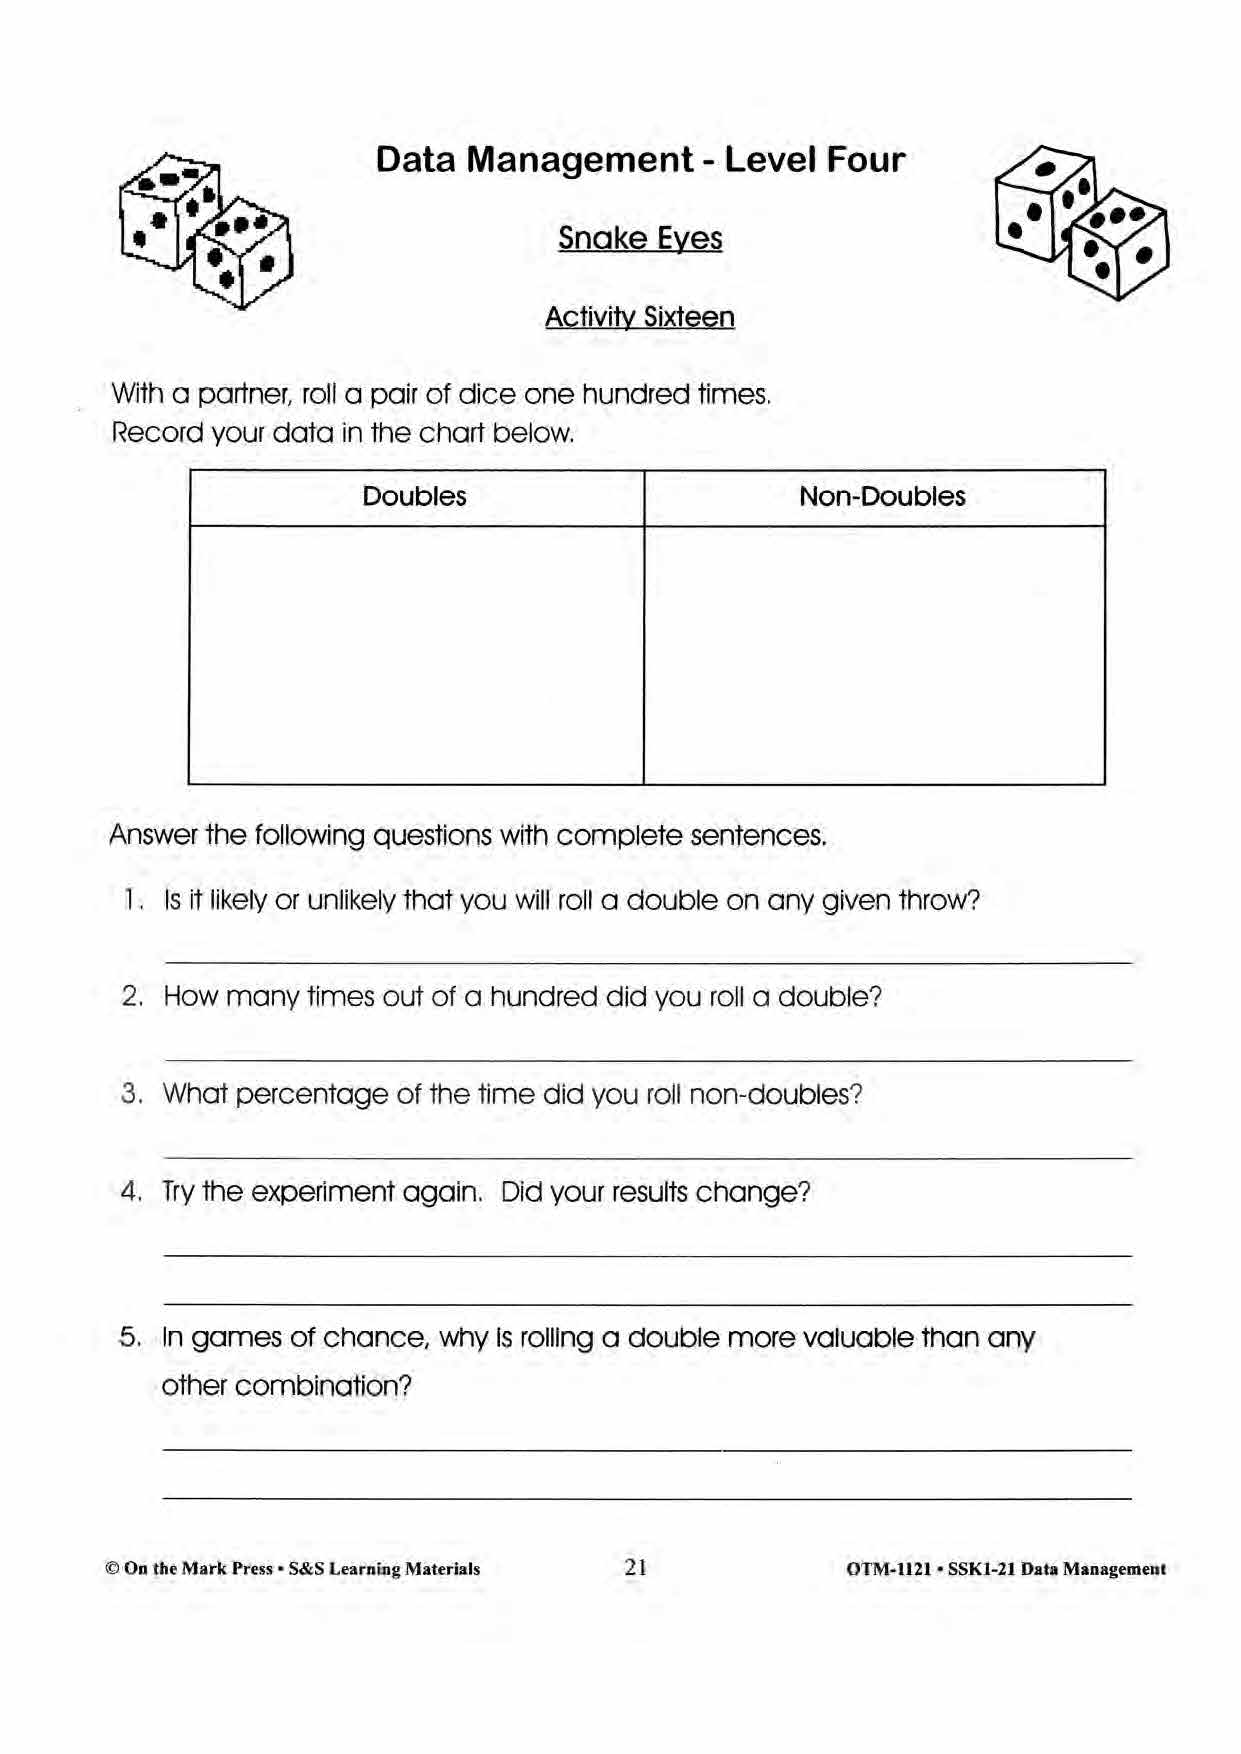
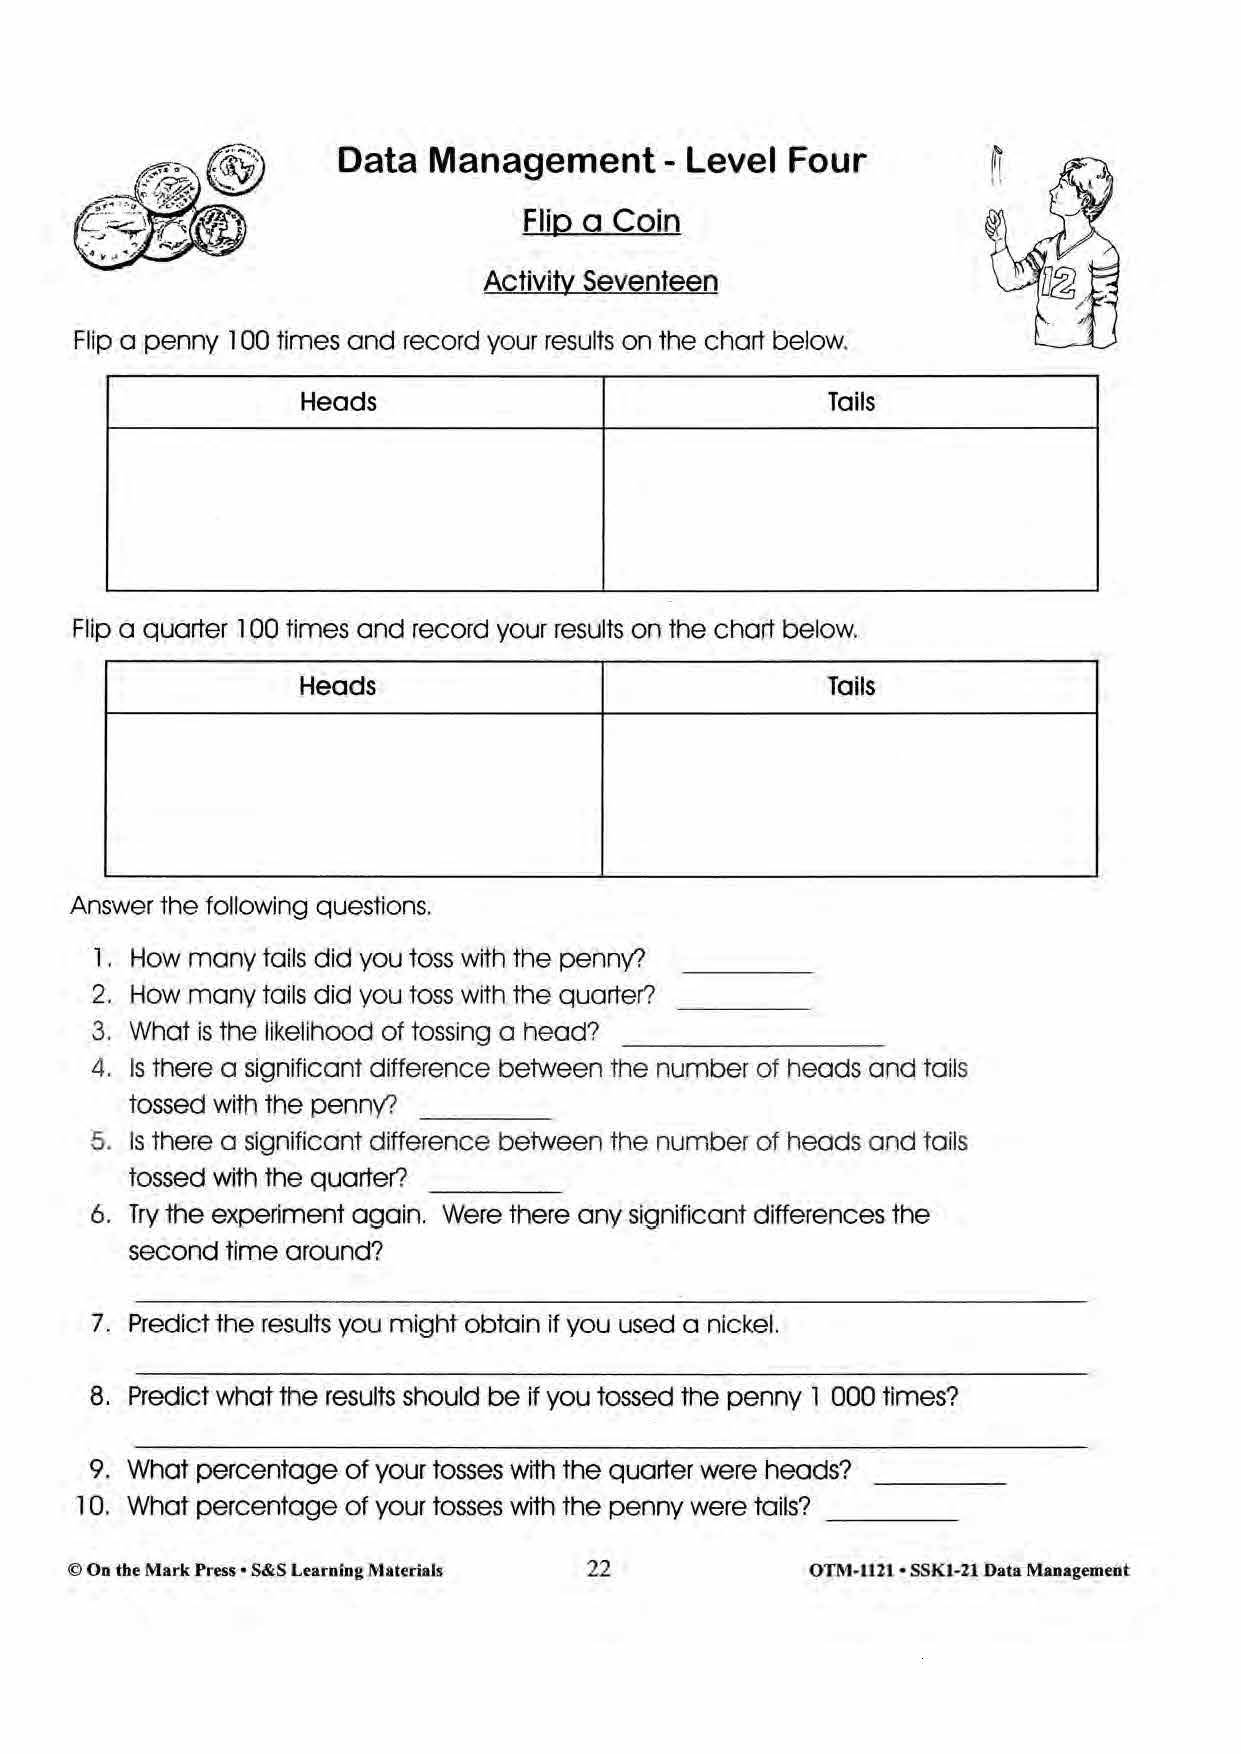
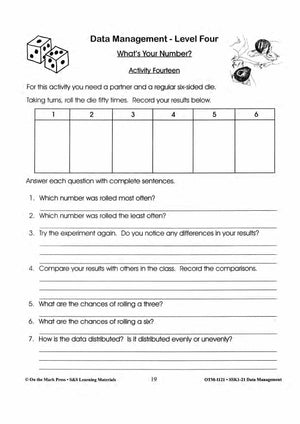
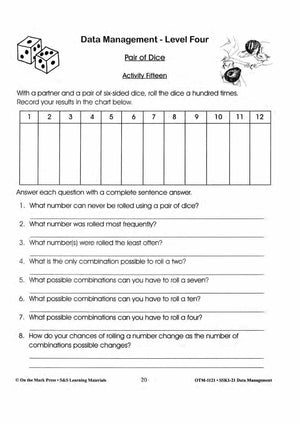
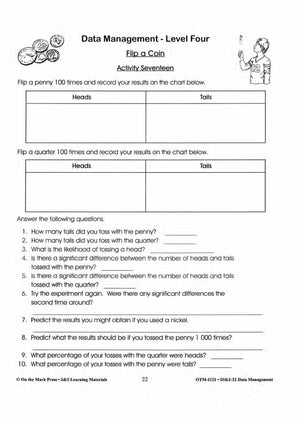
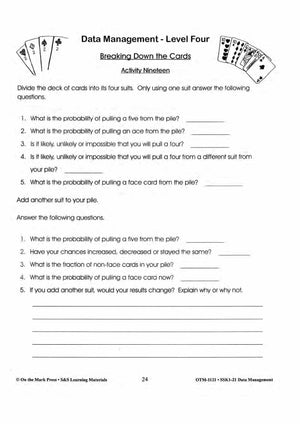
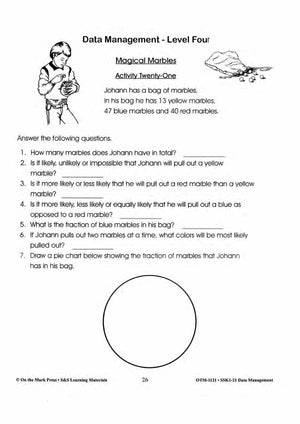
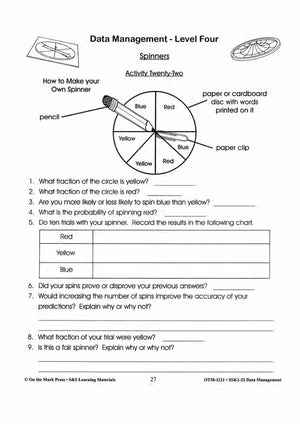
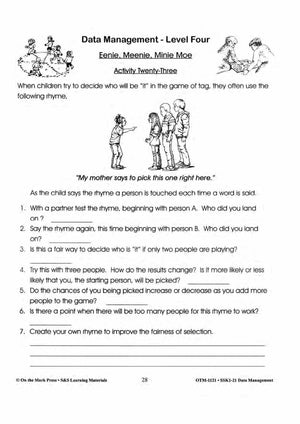
- Students should be instructed in the use of terms such as likely, unlikely, and impossible when talking about probability.
- Students will use a variety of manipulatives to demonstrate the probabilities in games of chance and in real-life situations. Spinners are more difficult and show the use of fractions.