


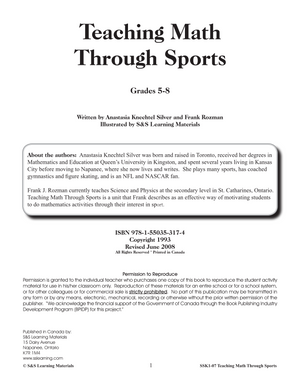
Teaching Math Through Sports (Canadian Version) Grades 5-8
EBK107
$24.99 CAD
Additional information:
- Author : Silver, Anastasia/Rozman, Fran
These real-world problems will motivate your students to apply their knowledge.
To appeal to all students, all kinds of sports have been included: skateboarding, biking, karate, parking lot basketball, track and field, soccer, hockey, baseball, and basketball. This culturally diverse resource ensures that students will relate to the settings in the problems while learning the curriculum. Designed for students in grades six through eight, and will be a benefit to students in grades five through nine.
Within each of the five strand sections, the worksheets are organized approximately by the grade level appropriate to the objectives of the sheet, and are arranged in order of increasing complexity.
Reproducible worksheets covering these math strands:
Numeration and Operations:
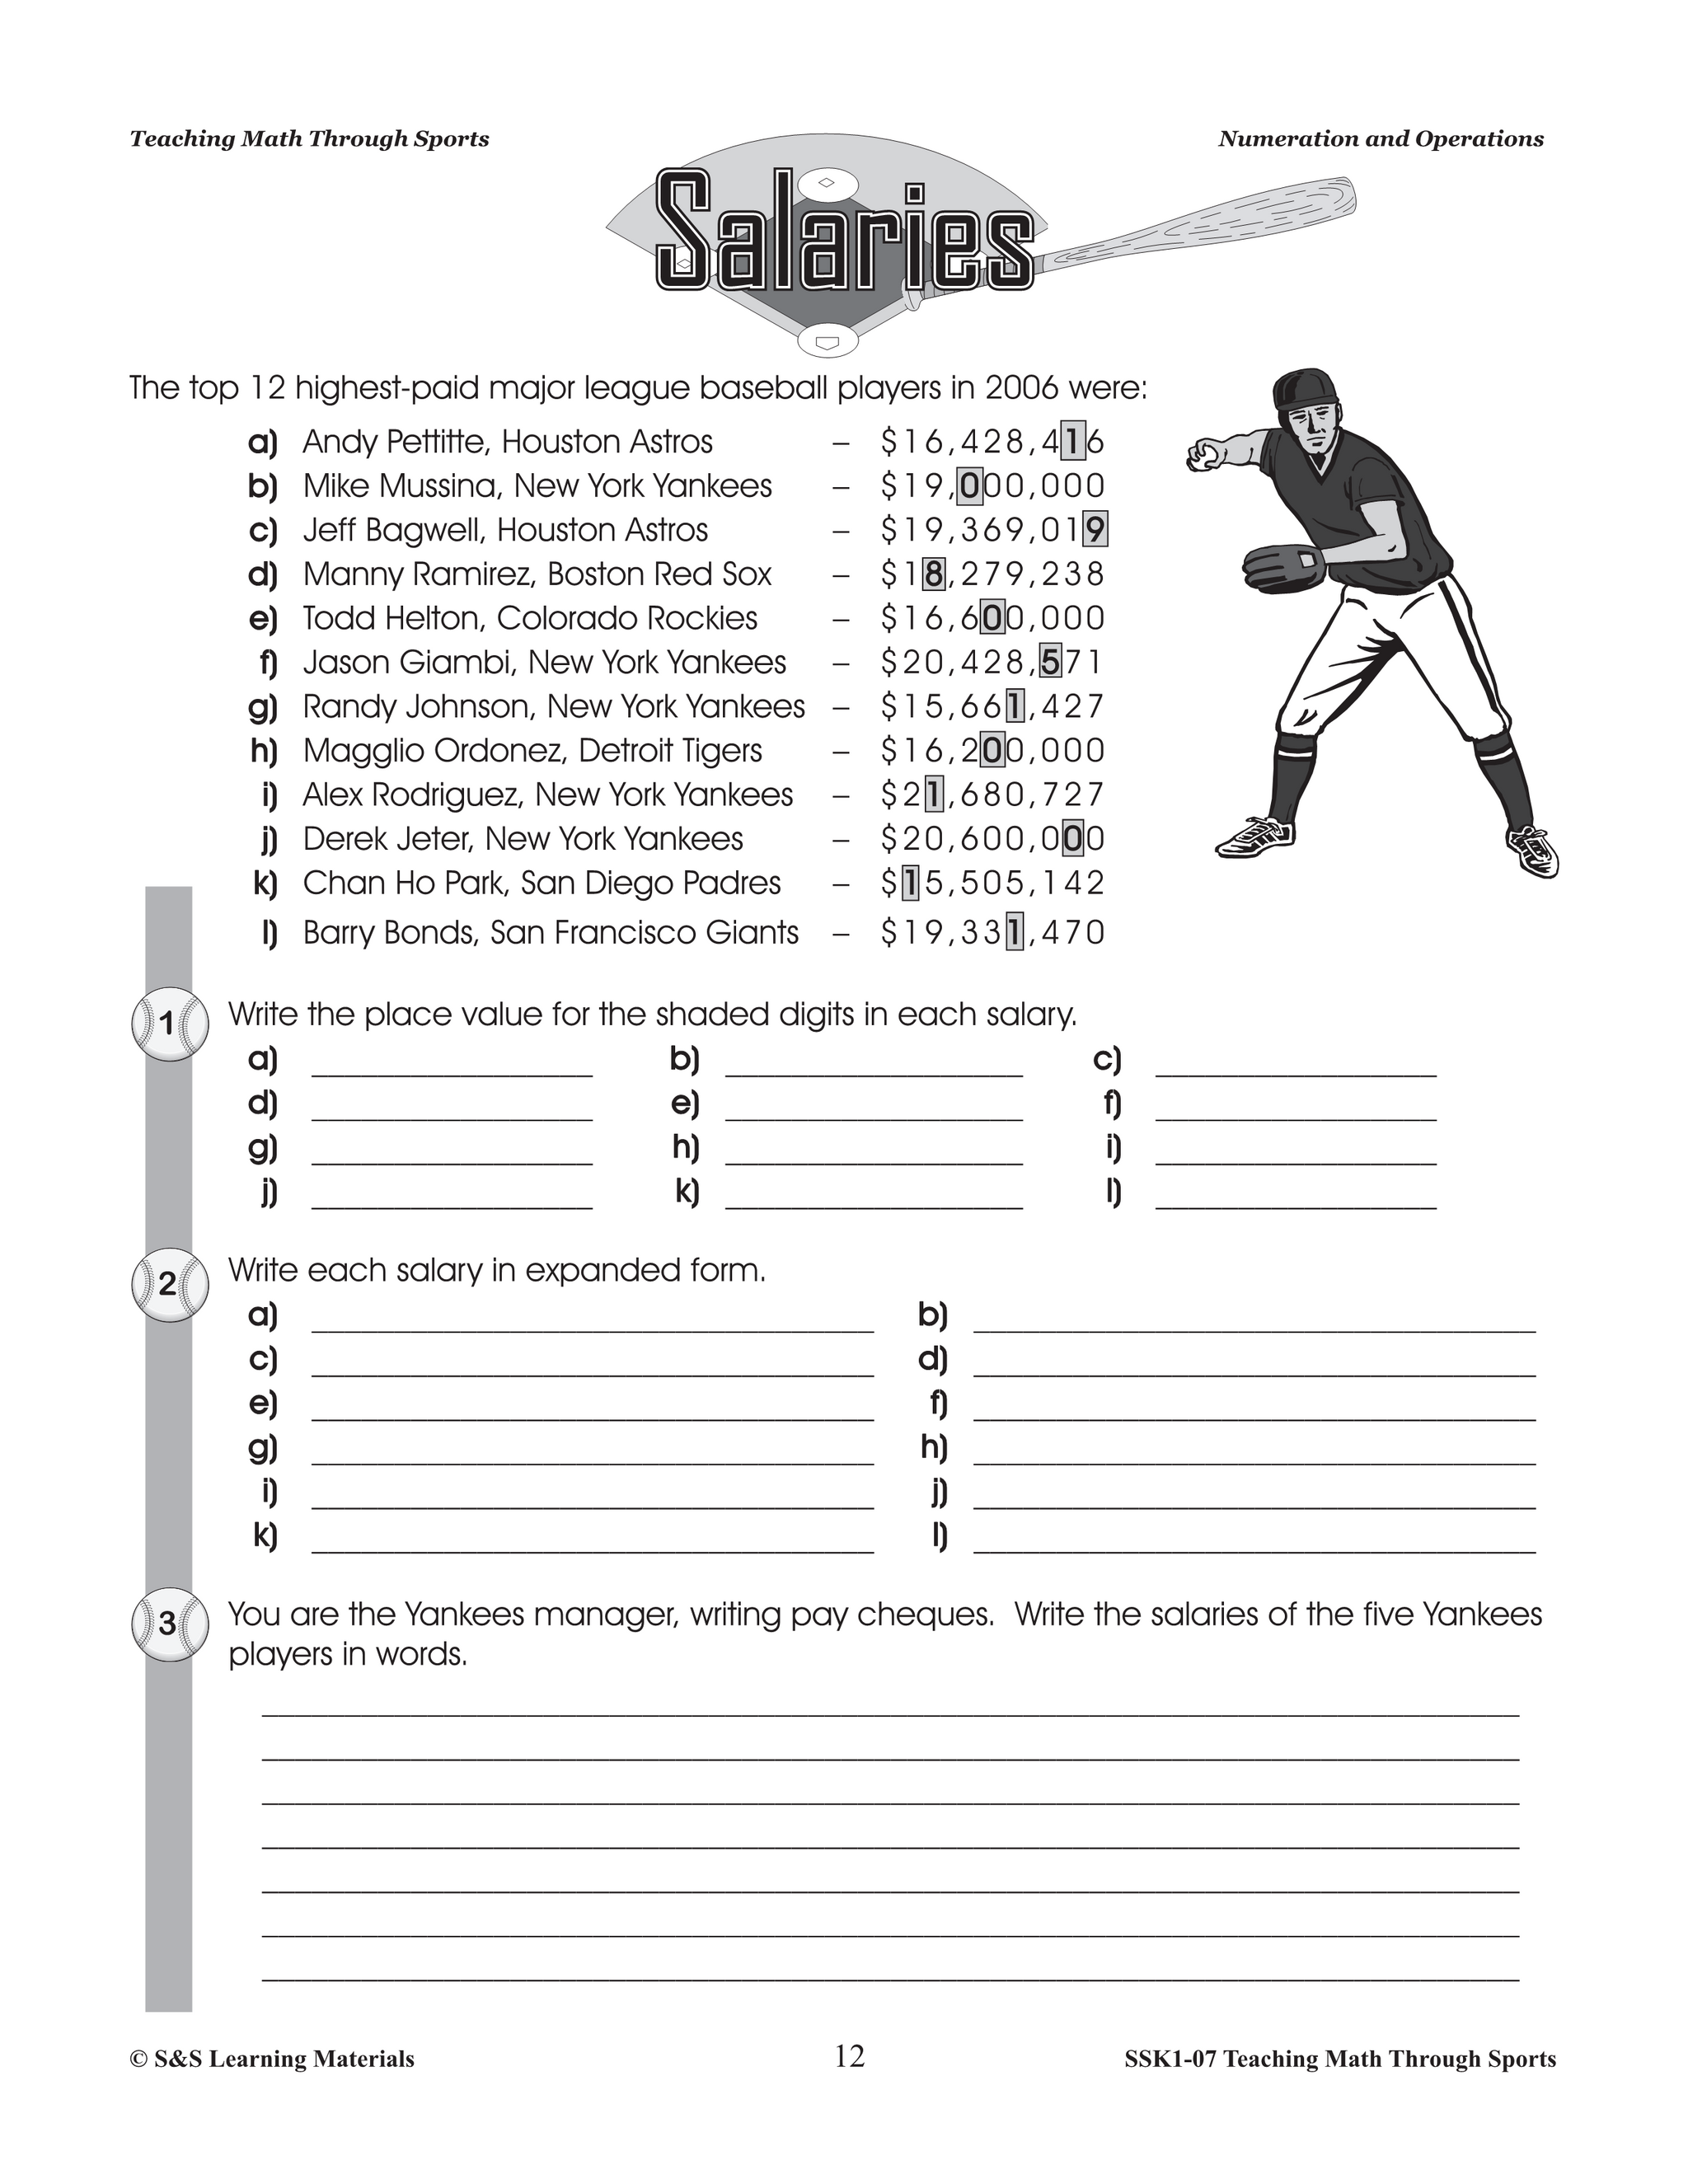
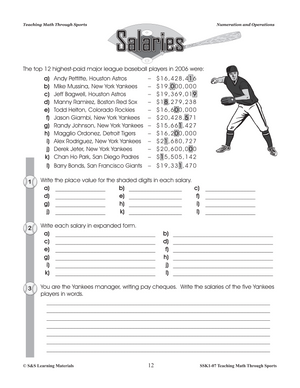
- Salaries (numerals, place value)
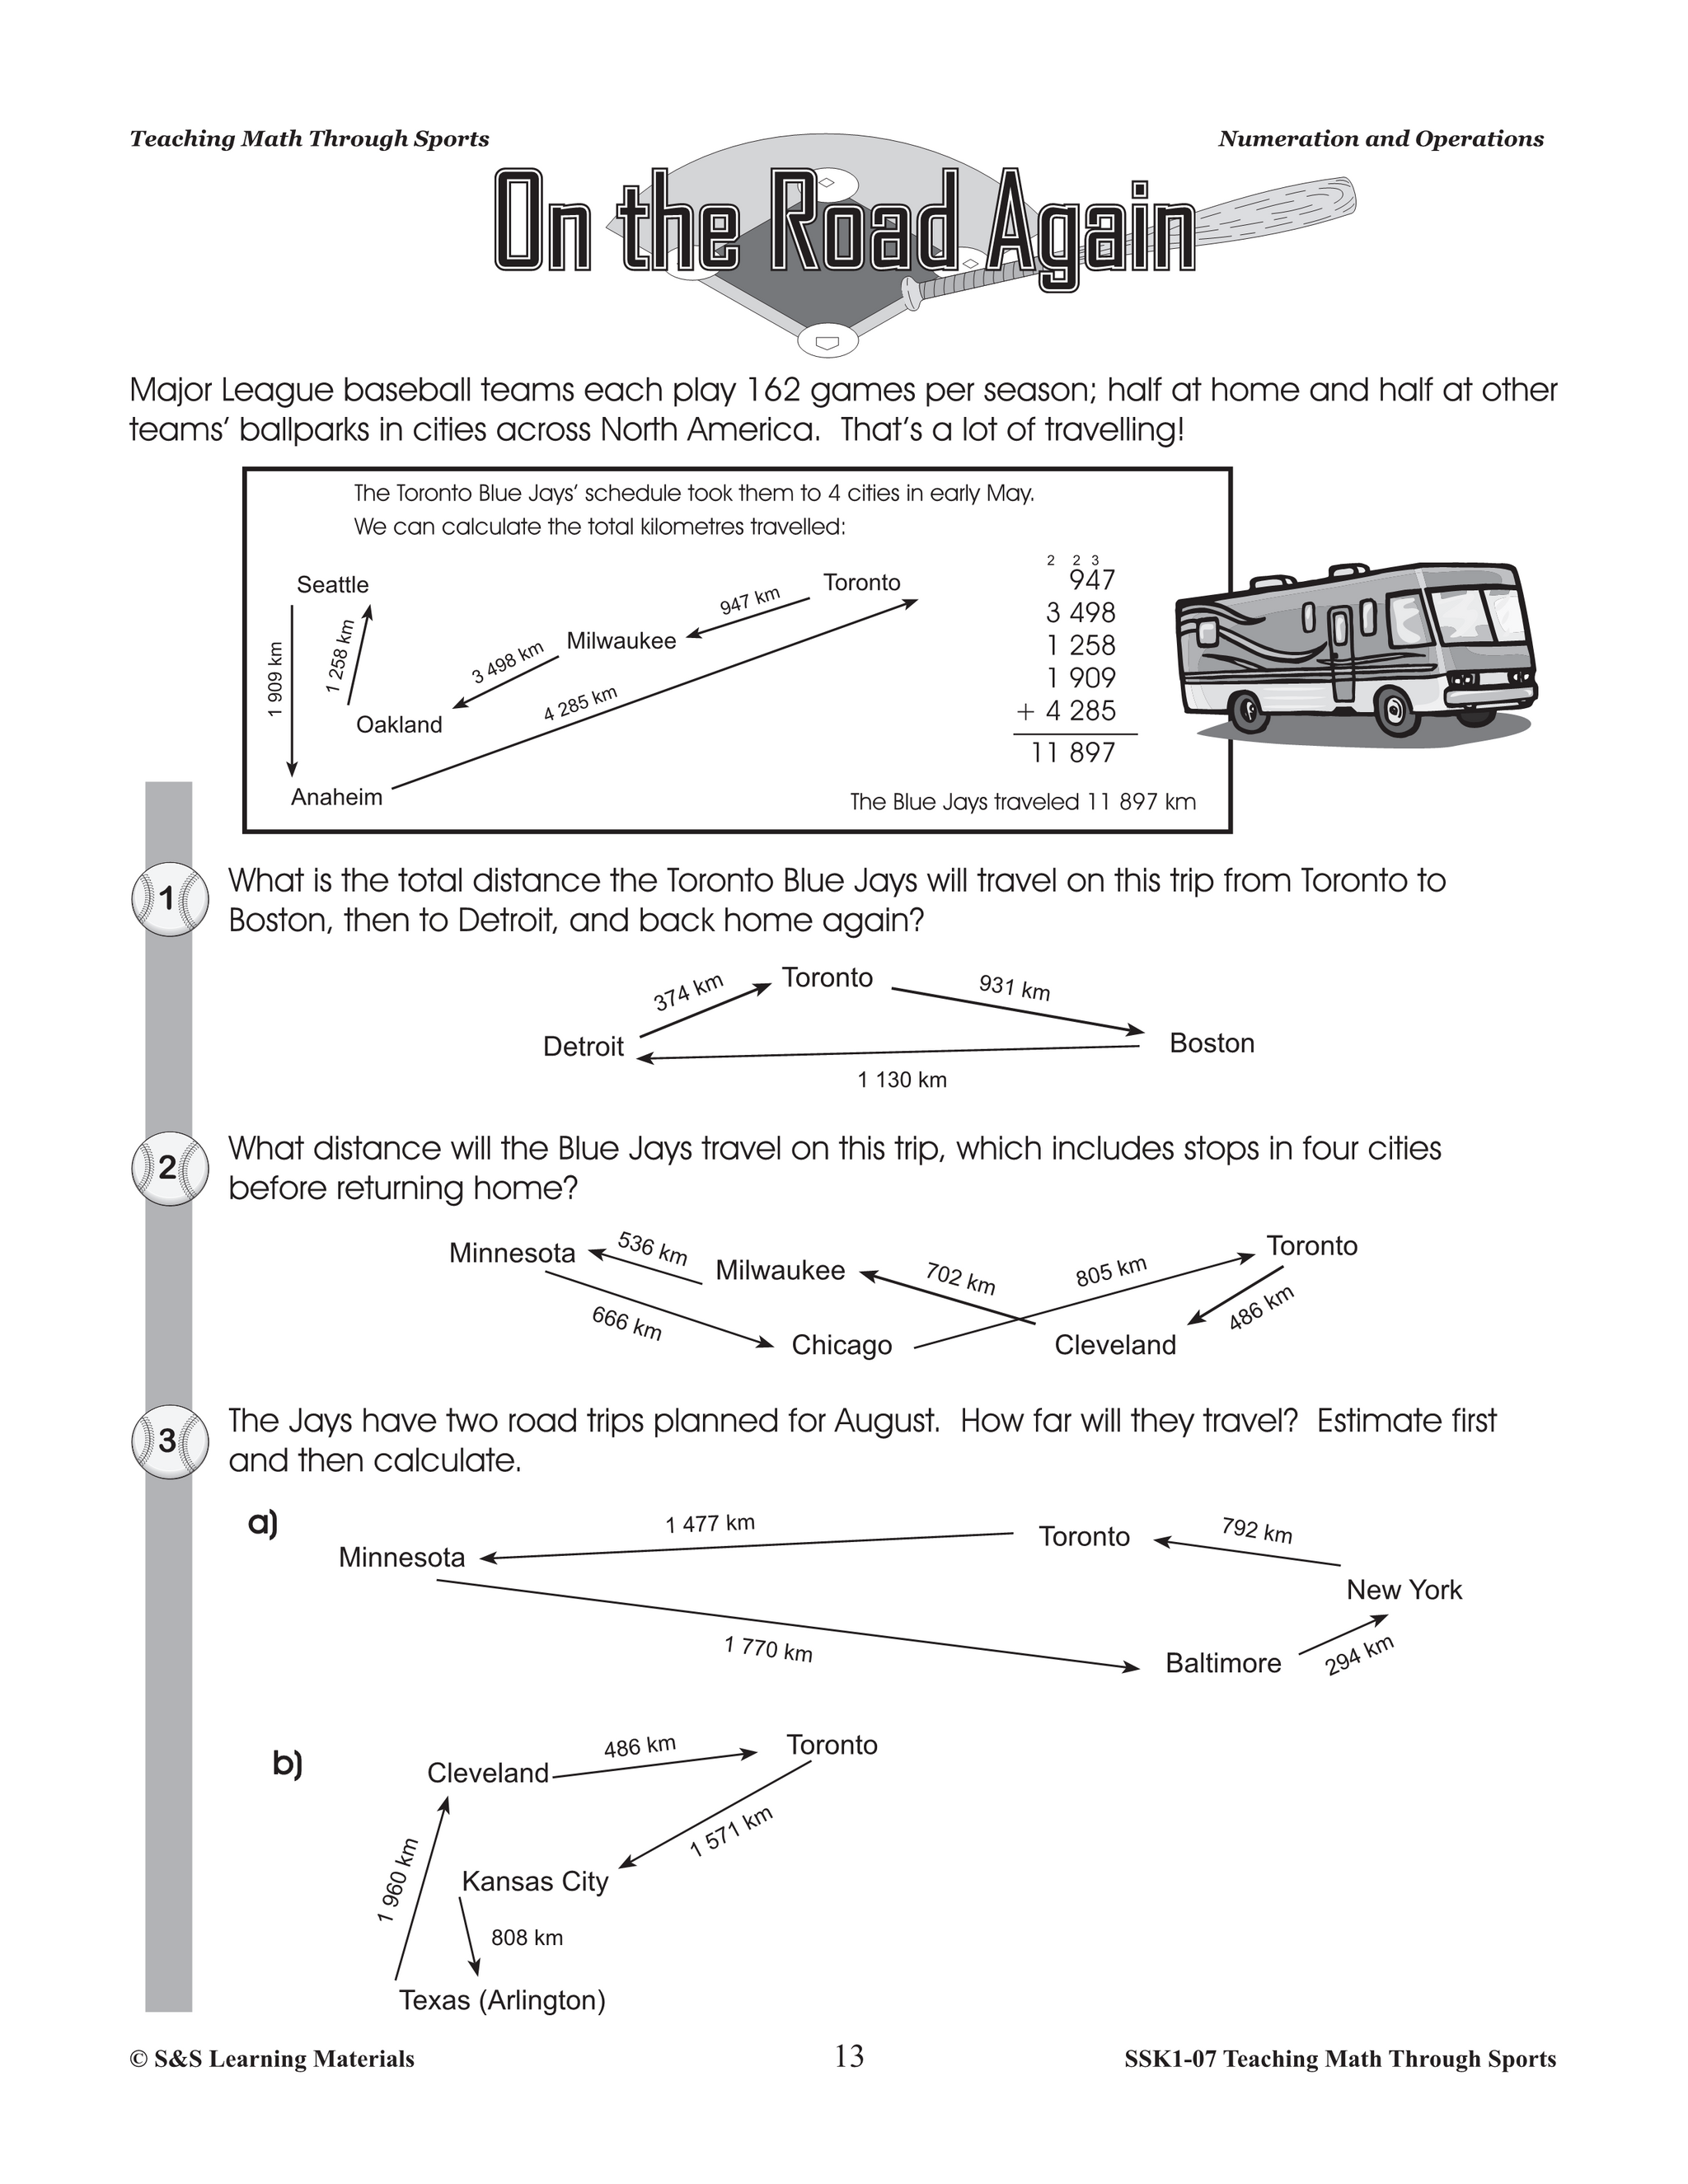
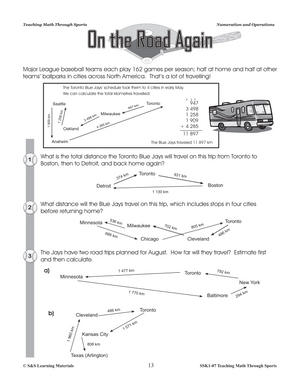
- On the Road Again (adding whole numbers)
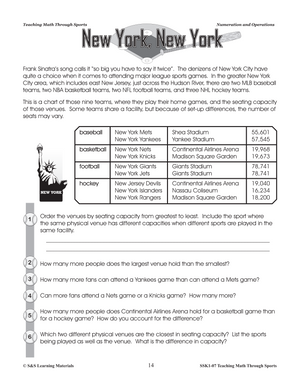
- New York, New York (subtracting whole numbers)
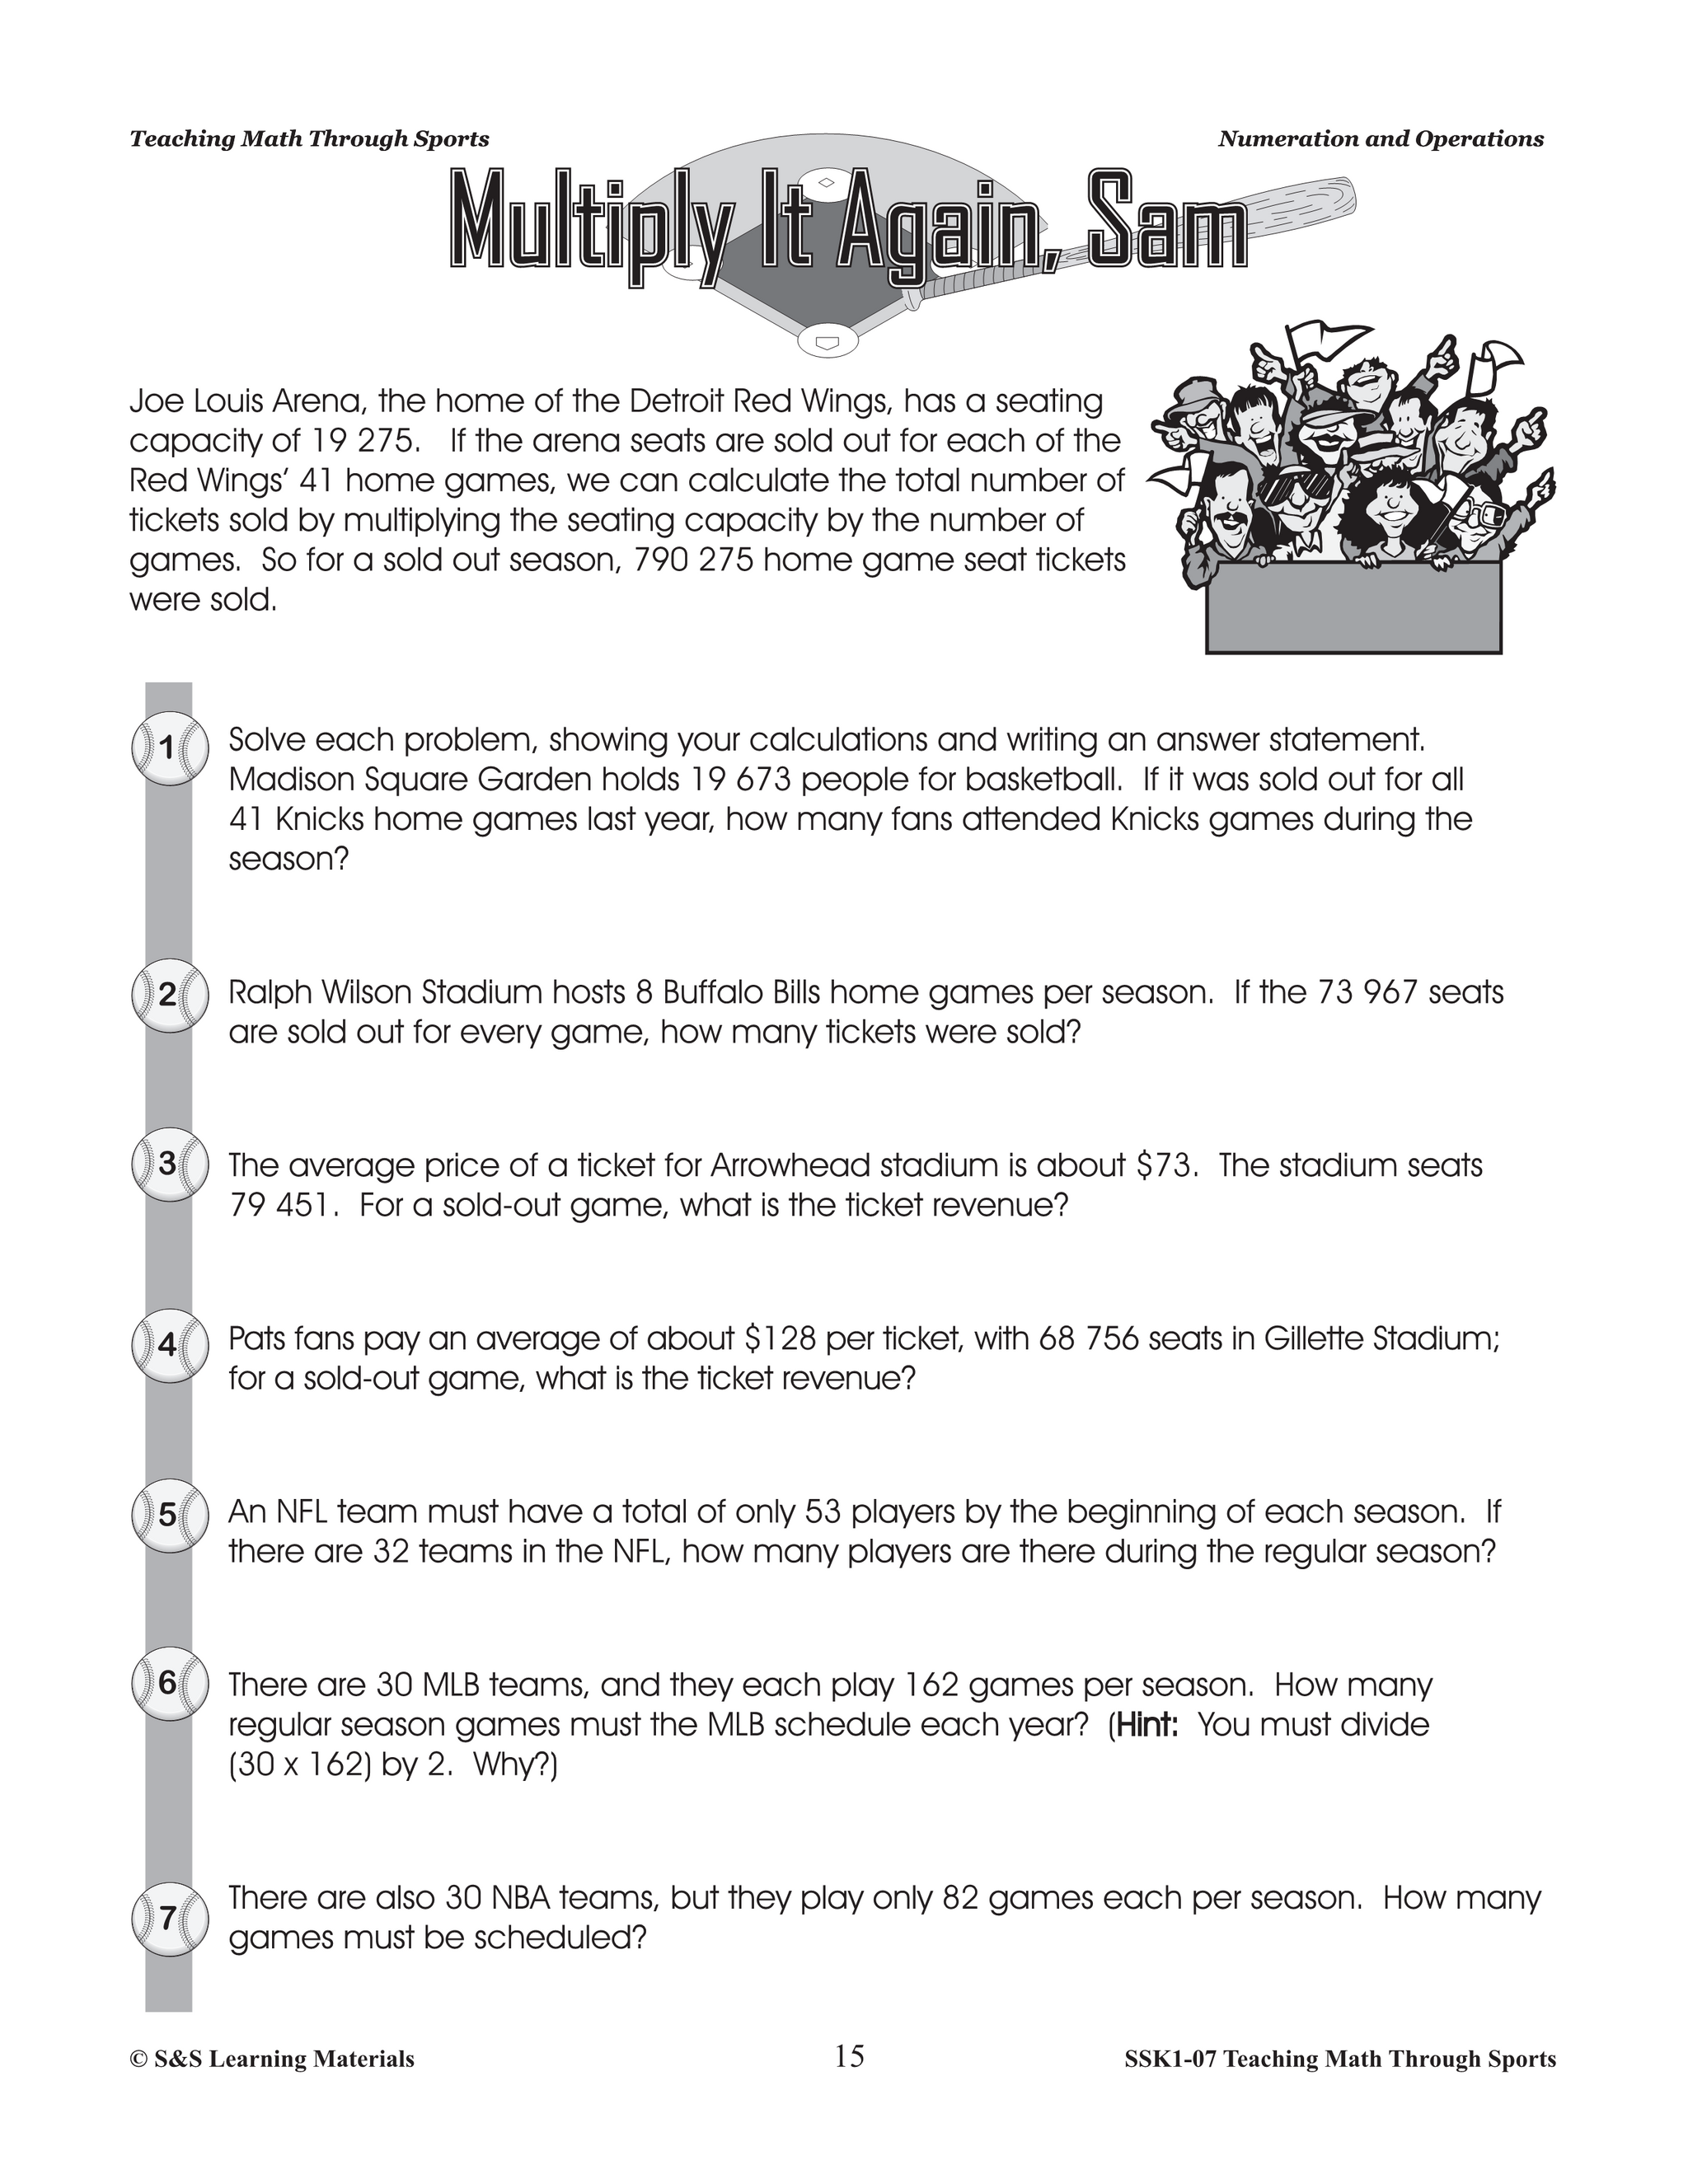
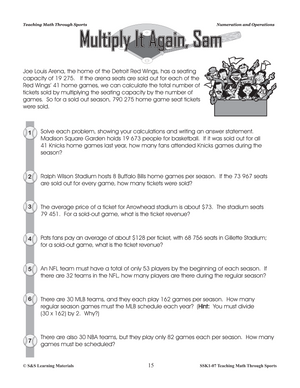
- Multiply It Again, Sam (multiplying whole numbers by 2- or 3-digit whole numbers)
- Short Divide (dividing whole numbers by 2- or 3-digit whole numbers)
- A Fraction of the Game (writing fractions)
- Mixed Numbers in Sports (mixed numbers and improper fractions)
- What’s in a Number? (prime and composite numbers)
- Shooting Percent (calculating percent)
- Oh, What a Season! (working with fractions)
- Rogers Centre, Home of the Jays! (working with percent)
- Par for the Course (working with integers)
- Net Goals (working with integers)
- Off to the Race! (working with rational numbers – mostly decimals)
- Marathon Stations (working with rational numbers – mostly fractions and percents)
Measurement:
- Units of Length in Sports (selecting appropriate units)
- Longer, Higher, Further (converting between different
- units within a system)
- All the Way Around (perimeter)
- The Area of Play (area of a rectangle)
- Arena Area (area of a rectangle)
- Keeping Time (measuring time, elapsed time)
- Turn Up the Volume! (volume of rectangular and triangular prisms)
- Free Throw Area (develop formula for area of a trapezoid)
- In the Swim (volume of prisms with composite faces)
- Circles on Ice (circumference of a circle)
- Half Pipes and Barrels (volume and surface area of a cylinder)
- Perfect Scale (proportion)
Geometry:
- Sports Polygons (classifying polygons by number of sides)
- Sort It Out (classifying 3-D shapes by properties)
- The Scoring Angle (classifying angles)
- The Shape of the Field (classifying polygons by symmetry, flip translation)
- Symmetrical Figures (flip, slide, and rational translations, symmetry)
- Size It Up (perform dilations)
- Line Segments on the Football Field (parallel, perpendicular, and intersecting lines)
- Coverage Patterns (tile a plane)
- Length of a Grind (use Pythagorean Theorem)
- Skate Park Shapes (construct described figures)
Algebra:
- Practice patterns (describe patterns, predict terms in a pattern)
- Tournament Patterns (describe patterns, predict terms)
- Soccer Drills (describe patterns in different ways)
- Scoring Equations (write algebraic expressions)
- Constant Rate of speed (write expressions, graph y = ax + b form, geometric series)
- Get in Line! (graphing constant speed as distance over time)
- Take Me Out to the Game (algebraic expressions, solve for variables)
- The Magic Number (substituting variables into an equation)
- Slugging Average (substituting for multiple variables)
- Weighty Equations (write equations and solve by balancing)
Data and Probability:
- These Players Are Not Average! (short division, introduction to averages)
- 92 for 99 (calculate mean, median, and mode for small data set)
- See You at the Olympics! (bar graph, multiple-bar-graph)
- Read Between the Lines (broken-line graphs)
- What Are the Odds? (probability and odds)
- Batting Average (average as a measure of probability, decimal representation, prediction)
- Tally of Favorites (collect, arrange, and display data, double-bar and line graphs, bias)
- Freestyle Stats (arrange and display data, circle graphs, bias in collection)
- How Tall Is... (comparing data groups by measures of central tendency, collect data)
- In Reach (scatterplot, survey, bias in data collection)
- Finish Times (tally chart, data intervals)
80 pages including an answer key.